Inspired from Franco Moretti work on literary corpus, this script provides a complete interface (files suffixed by distant.html in the resulting dataset directory) for comparing the dynamics of a series of items in a corpus. It is mainly designed to compare words from a given textual field but could be used for other purposes…
Distance reading parameters
Textual fields
Choose the textual fields from which you want to extract multi-terms. Don’t use already existing terms but the raw textual content field!
Terms List
Choose a pre-defined list of terms produced by Terms Extraction script. If you provide a term list, that should be formatted in the usual three columns spreadsheet (see corpus_terms_indexer page), only words and stems present in the file will be indexed.
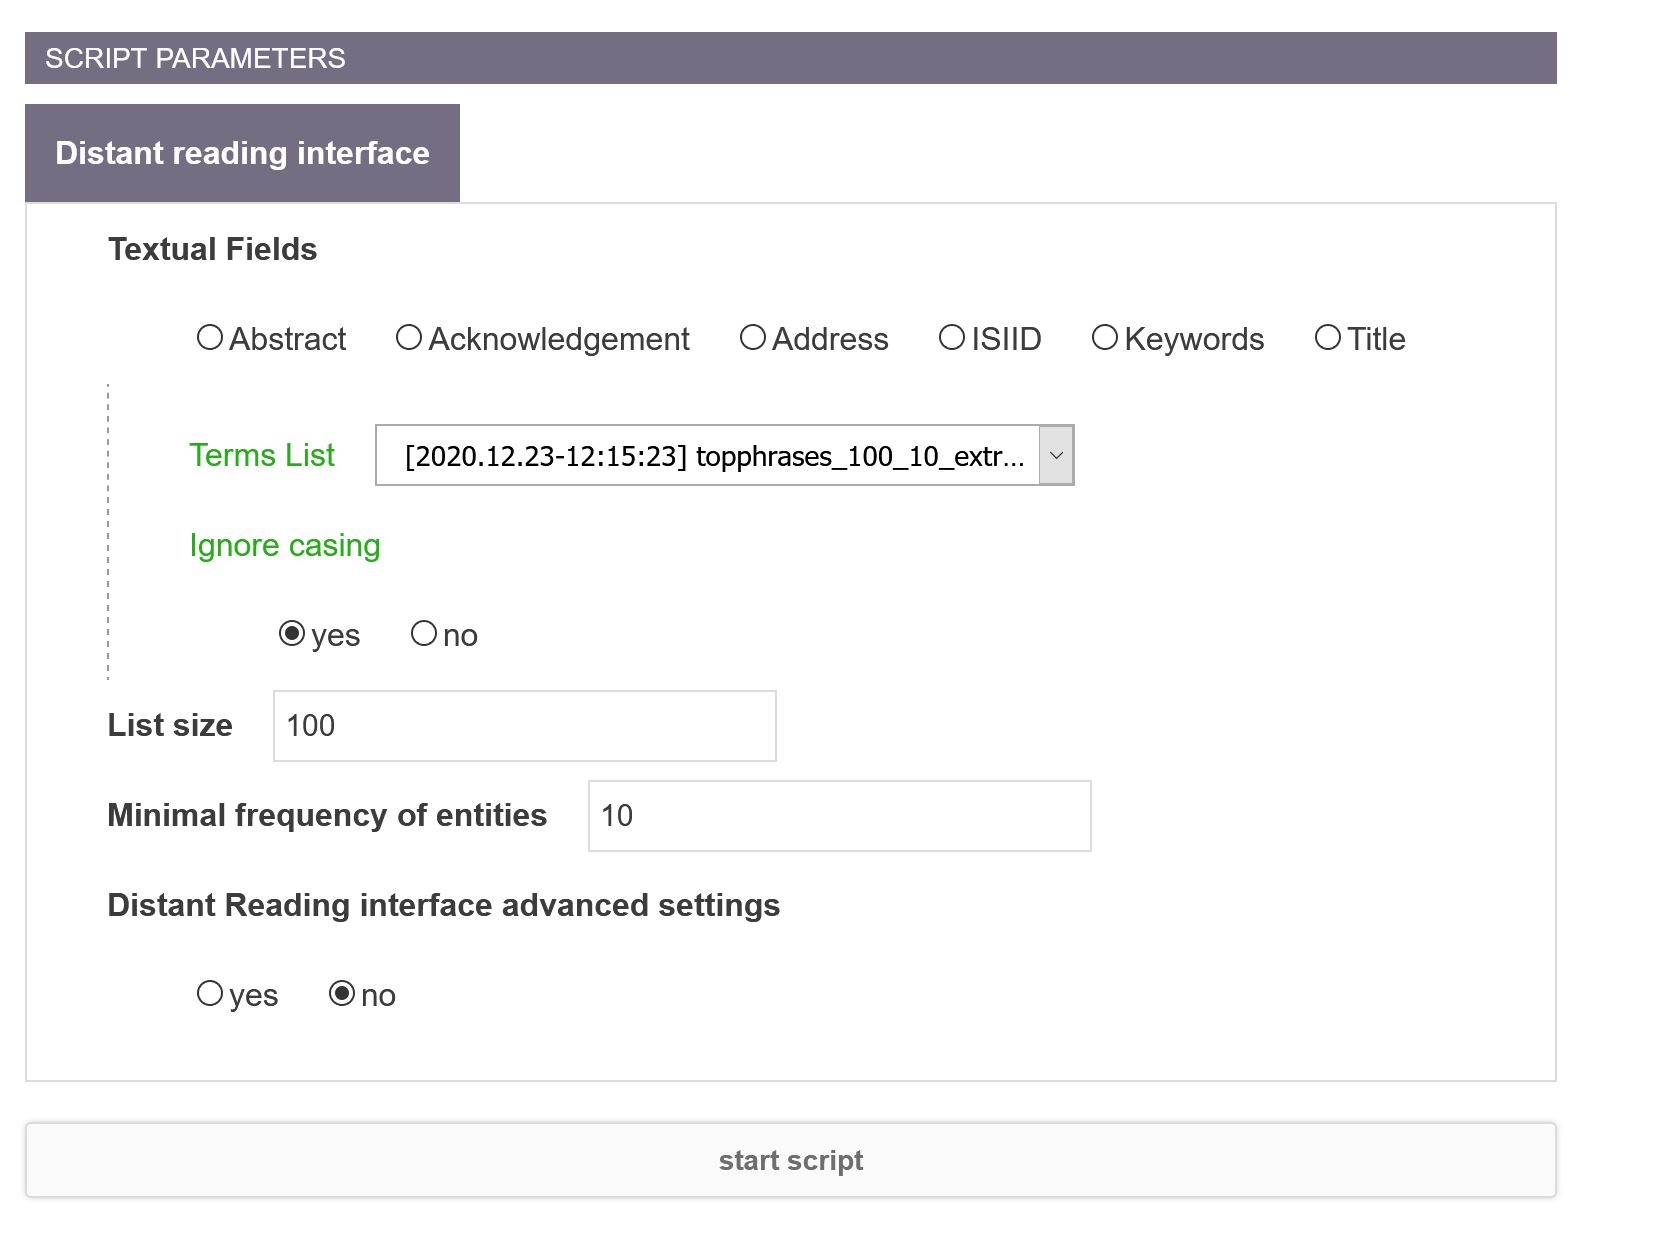
List size
In both cases, you can define the total number of items (only N most frequent ones will be conserved).
Minimal frequency of entities
Exclude entities with a low frequency.
It is now also possible to compare the dynamics of a word in a given corpus with its dynamics in another one.
Distance reading interface advanced parameters
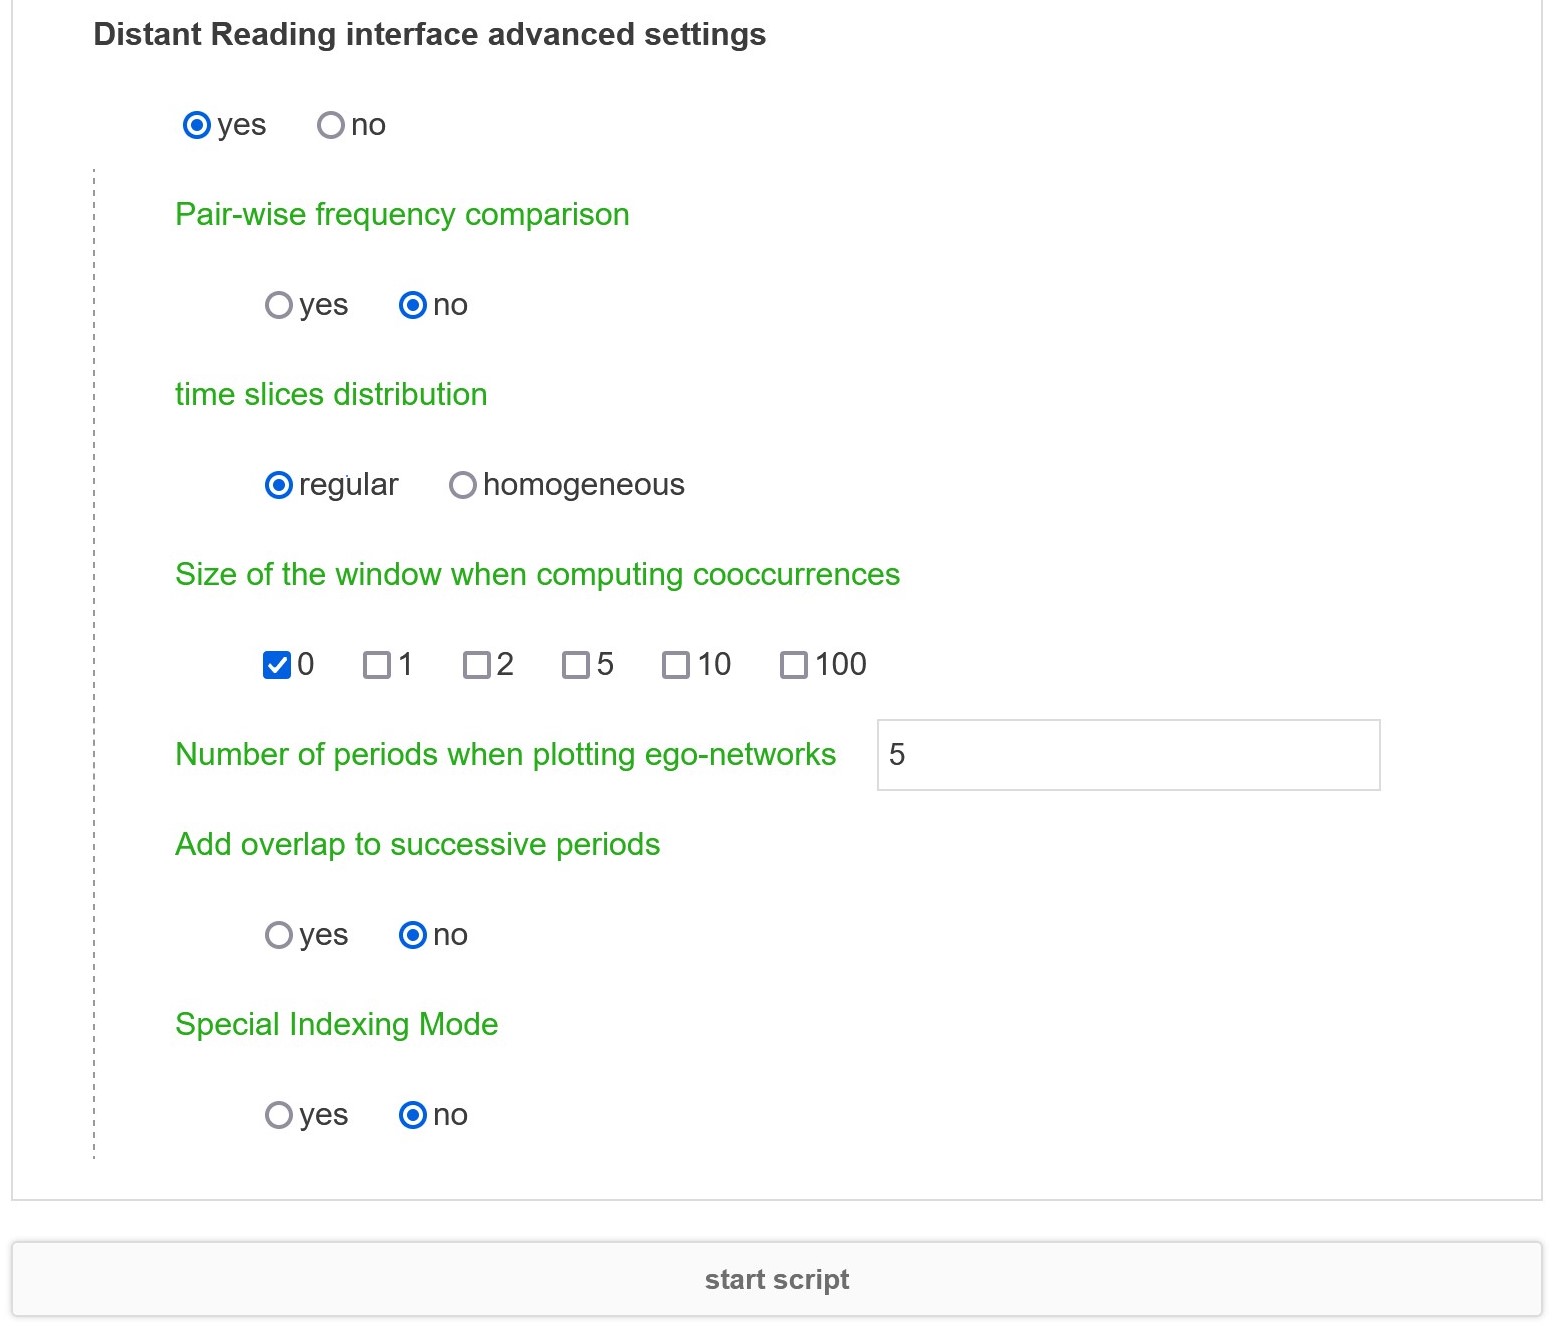
Some advanced parameters are accessible mainly to refine the behavior of the coocurrences calculation.
Pair-wise frequency comparison
Activate this option to compare this corpus time series with frequencies measured on another corpus. You will be asked to select a background frequency file (obtained after a previous run of distant reading script on another corpus).
Regular time slices will split the time uniformly according to timesteps, homogeneous time slices will split the time uniformly according to the number of documents.
Size of the window when computing cooccurrences
Size of the windows (in number of sentences) when computing cooccurrences (0 means words must appear in the same sentence, 5 at most 5 sentences apart, etc.). It will make Distance Reading script able to produce one Bump Chart and one Egonetwork for each selected Size of the windows. See Context window configuration for more information on that.
Number of periods when plotting ego-networks
Number of periods when plotting ego-networks (max number of periods is 5).
Special Indexing Mode
If your textual data is in a non-occidental language or if your word list include non ascii characters, please use the alternative word indexing method (slightly less accurate but safer).
How to use CorText Manager distance reading interface
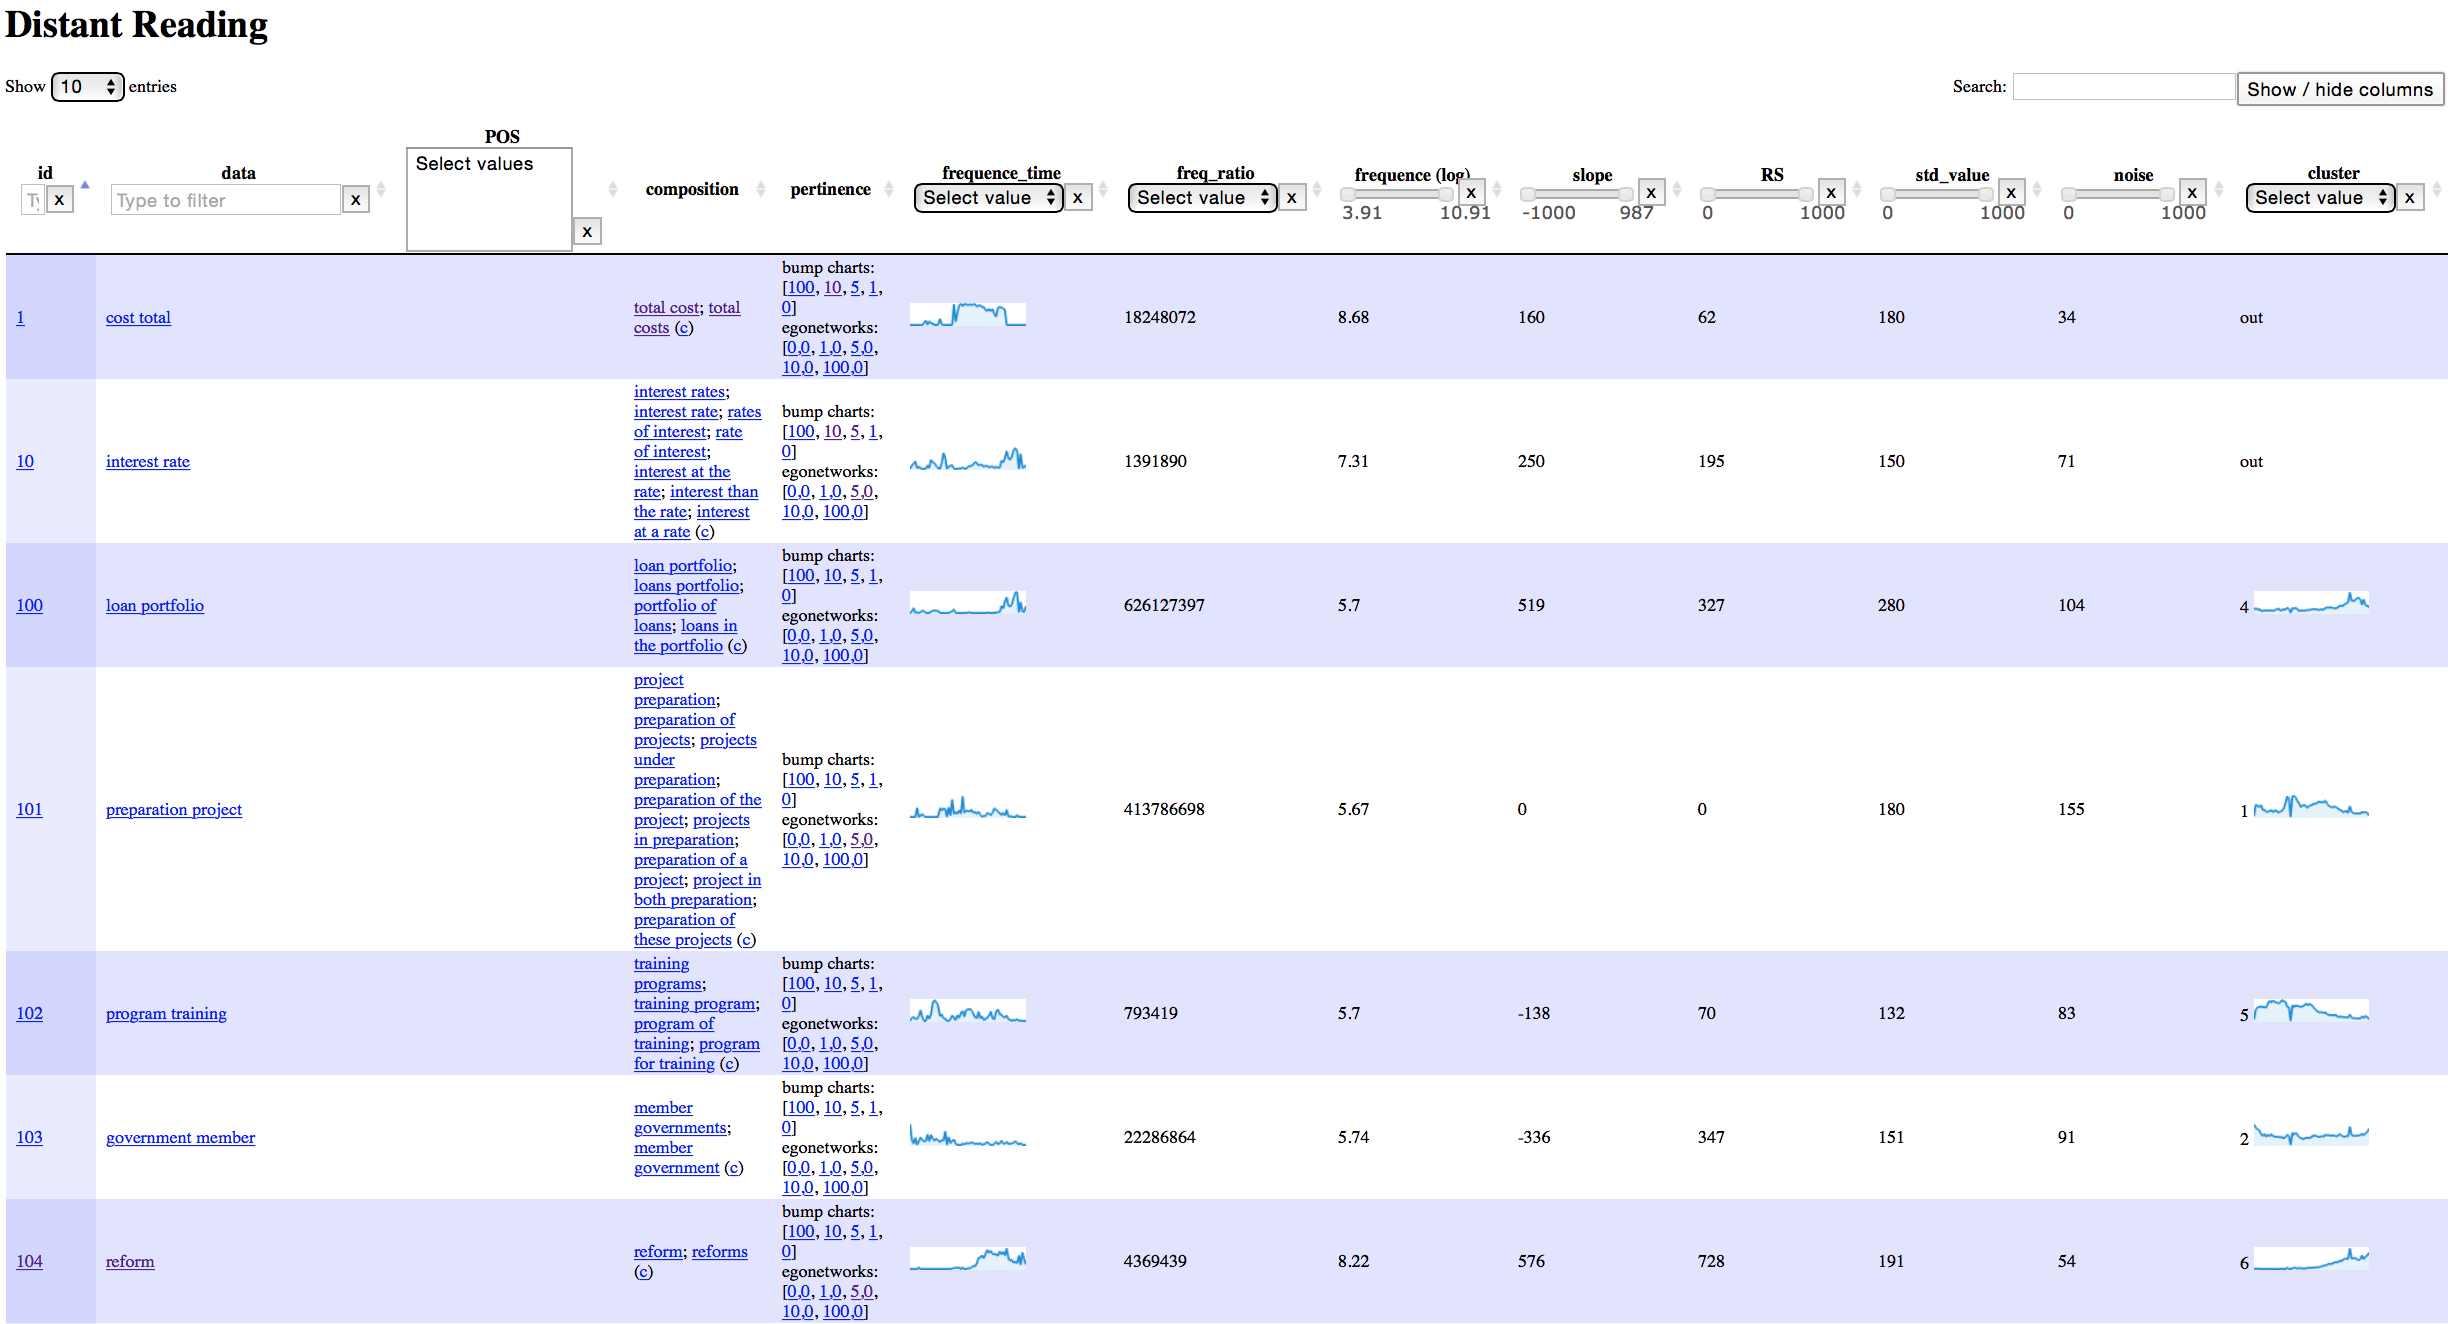
Available metrics and visualization in the final interface (thanks to Pablo Ruiz for having established this full documentation) are listed below:
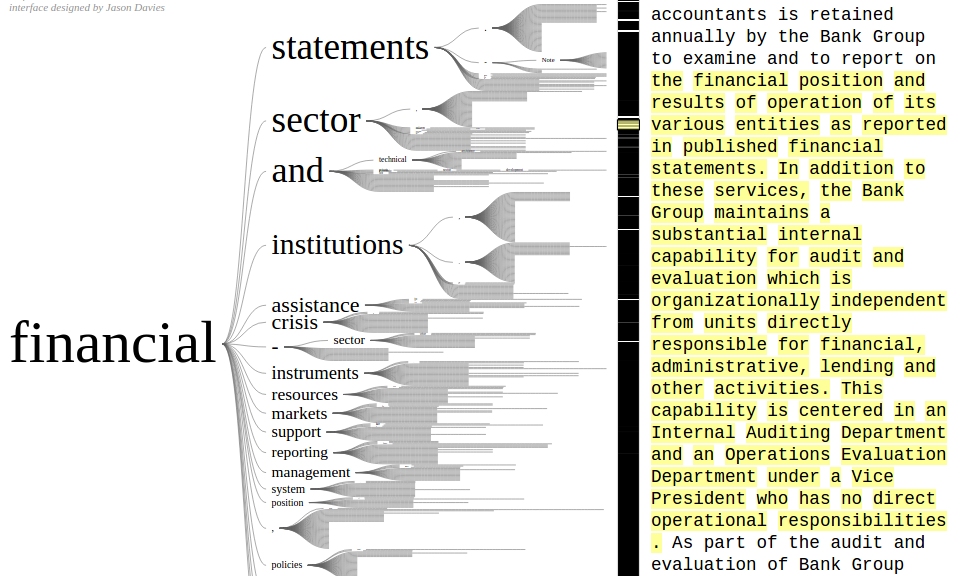
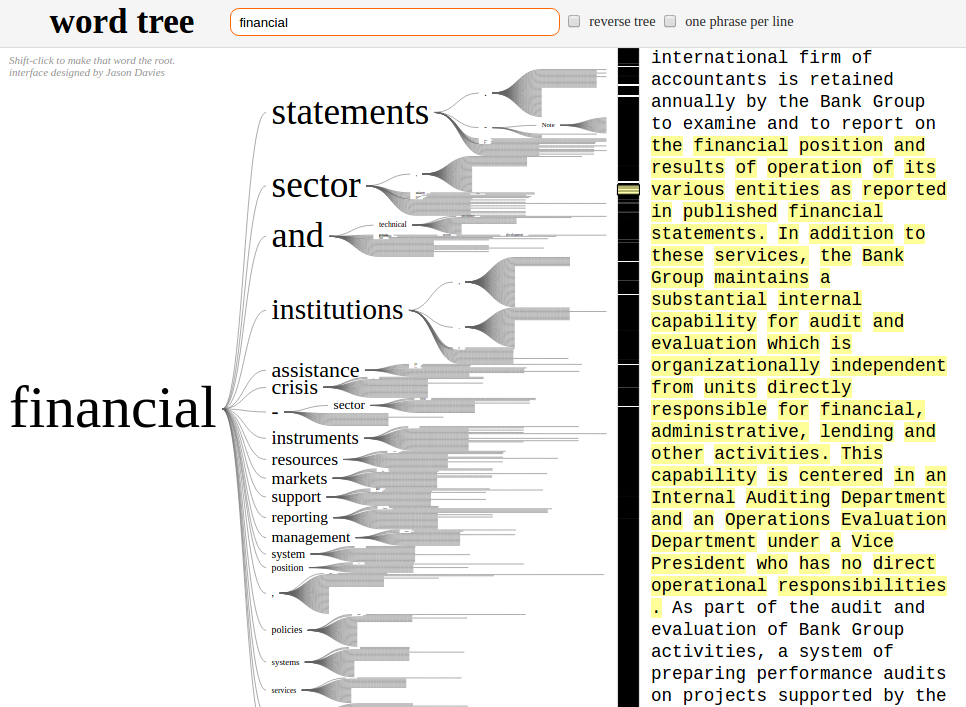
Word Tree
The word tree visualisation technique has been invented by Martin Wattenberg and Fernanda Viégas (Wattenberg et al. 2008). Based on this work, CorText Manager is using the excellent word tree web interface developed by Jason Davies.
You can access the Word Tree by clicking on the (c) next to each term on the list. This will display a Word Tree for the corpus focused on that term: A representation for the corpus where series of two branches start from the term and its neighbours, like in the screenshot below for the word financial in the Bankspeak corpus.
Bump Charts
It helps studying the evolution of a term’s context. The corpus is divided into several periods, and the bump chart displays the most 10 frequent neighbours for the term at each period, within a configurable context window. See the screenshot below for the evolution of neighbours for the term financial in the Bankspeak corpus.
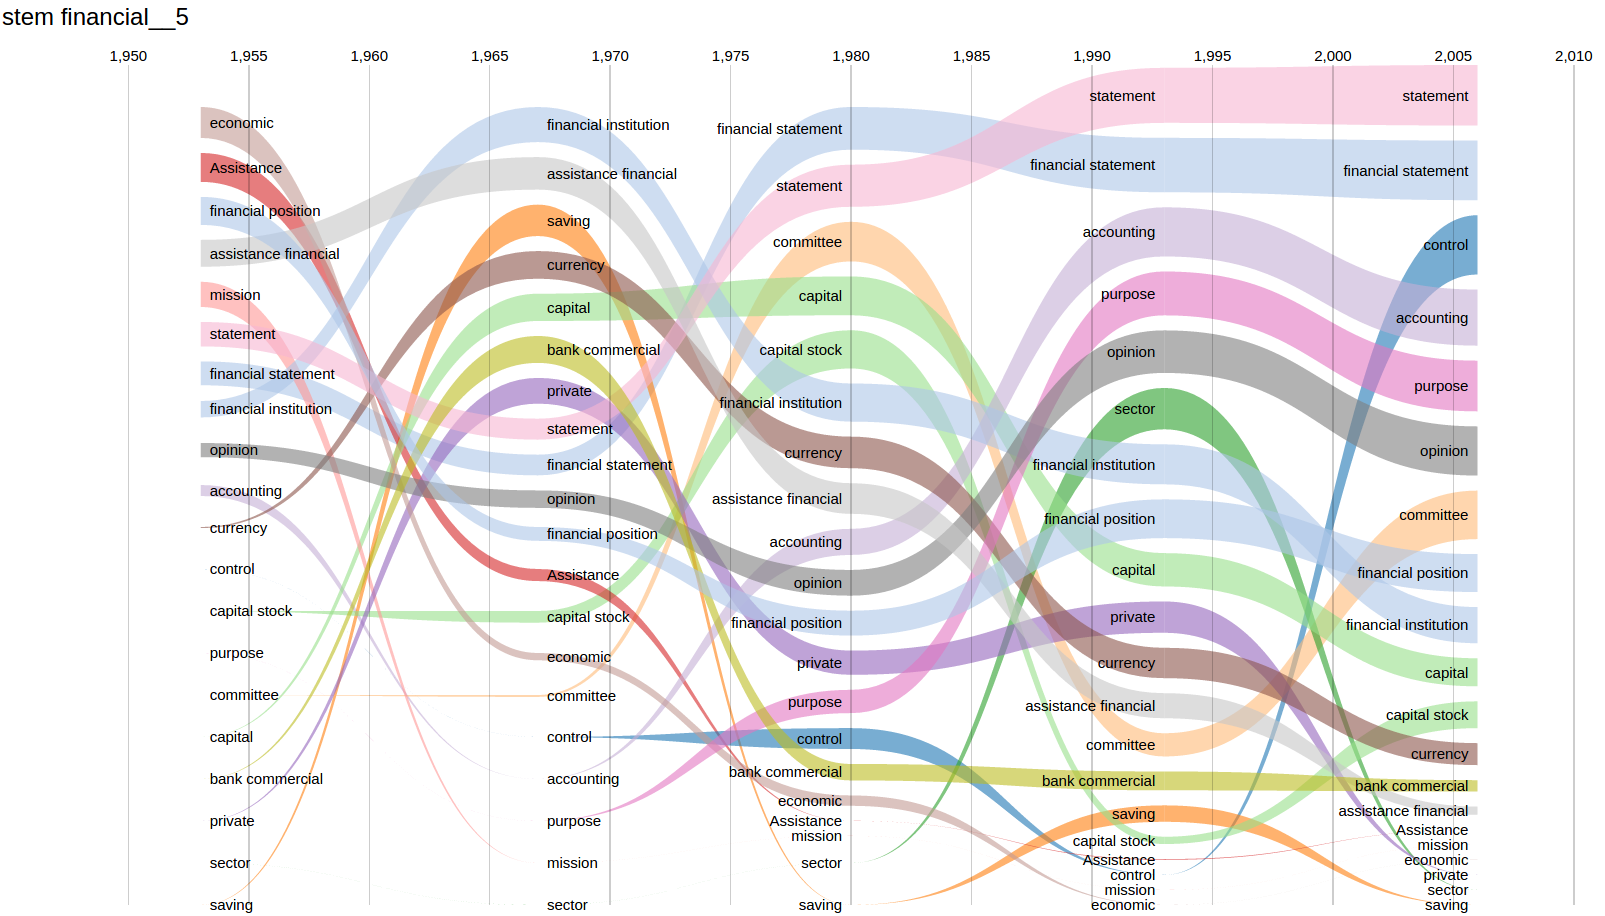
In early periods, notions like assistance or mission were more frequent as neighbours of financial than in later periods, where the most frequent neighbours belong to the accounting domain (e.g. financial statement or accounting). The word purpose may have replaced mission.
Egonetworks
Whereas the bump charts show the evolution of a terms’ most frequent neighbours, the egonetworks show how those neighbours for a given term are connected to each other; they provide an indication of the structure of a term’s context.
In the two screenshots below, we see egonetworks for neighbours of financial at two different periods in the corpus, where the different structure among those neighbours at each period can be observed.
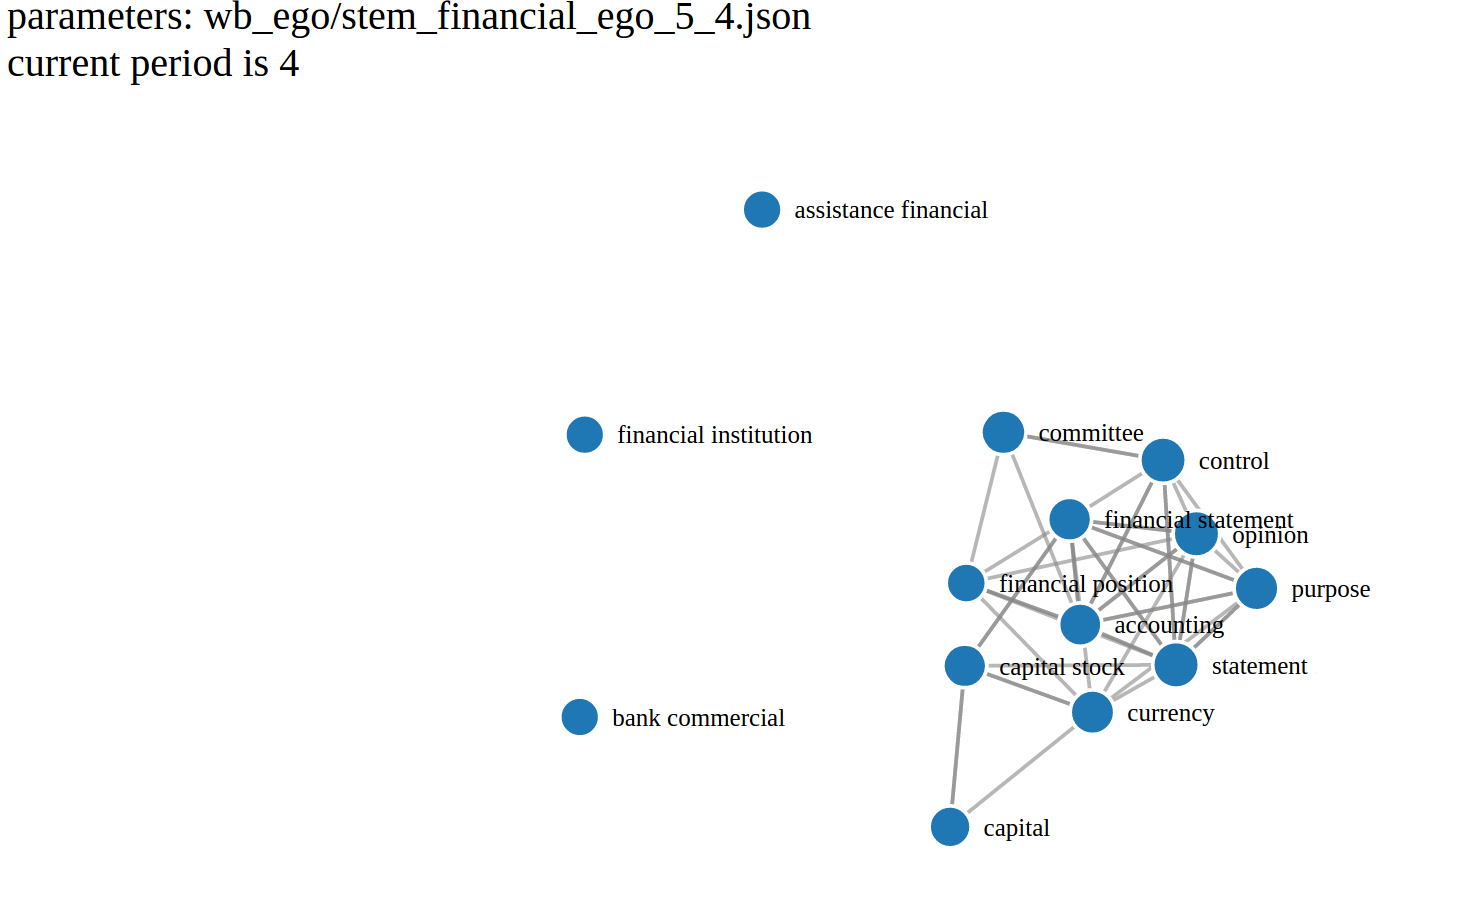
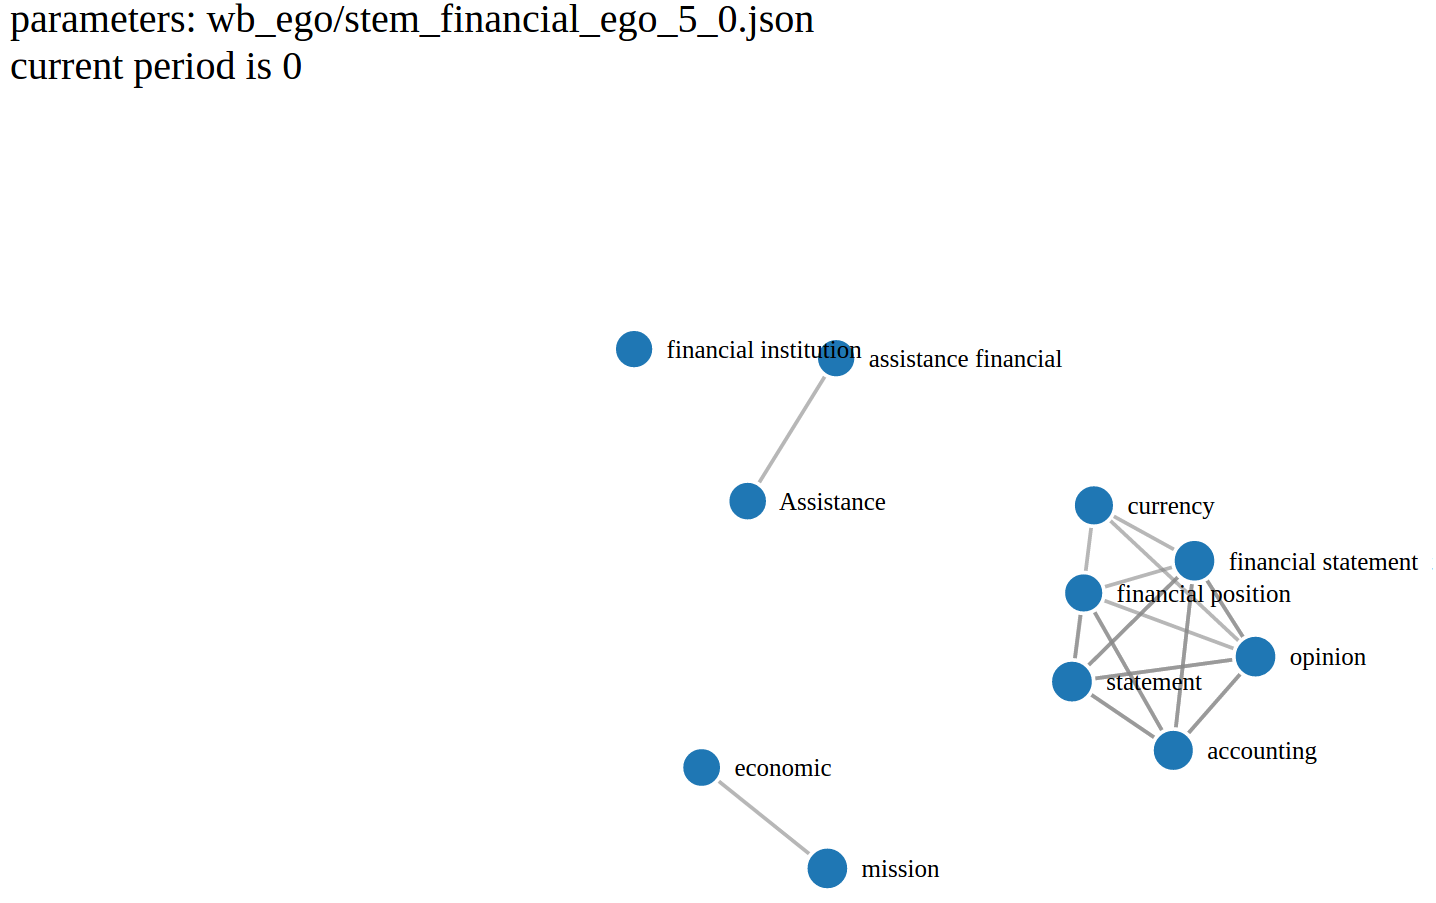
In the earlier period (period 0), there is a connection between assistance and assistance financial, whereas in the corpus’ last analyzed period (period 4), assistance is disconnected from any other neighbour of financial.
Context window configuration
For Bump Charts and Egonetworks, the context windows that will be analyzed can be defined when processing the corpus with the Distant Reading Dialogue (see the Distant Reading Tutorial video and the advanced parameters Size of the window when computing cooccurrences).
The different windows configured can then be selected from the Distant Reading UI itself, using the link that indicates the context (see the screenshot below):
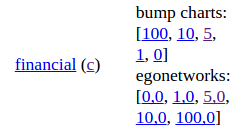
[0,0]: context is restricted to the same sentence
[5,0]: context is restricted to a window of 5 sentences around the term
[100,0]: context is restricted to a window of 100 sentences around the term
Slope
Determines the amount of frequency change that the term needs to have undergone to be kept in the filtered set, as well as the direction of this change.
A positive slope means that the term occurs more frequently in later periods of the corpus than in its earlier periods (using relative frequencies, normalized by the size of the corpus for each period).
A negative slope means that the frequency of occurrences in earlier periods is higher than in later periods of the corpus (these frequencies are again normalized taking into account the size of the corpus slice contained in each period).
RS, std_value and noise
Measures of “burstiness”, indicating to what an extent the term has had spikes of occurrence at given moments in the corpus.
Using these filters you can restrict the terms displayed to terms whose temporal profile interests you: terms the use of which increases with time, terms that increasingly become less used in the corpus, or terms who show “spikes” or “bursts” in their usage.
Besides the temporal profiles for individual terms in the corpus, the Distant Reading module also calculates an evolution profile type or evolution profile cluster based on the evolution profiles for individual terms. This is displayed in the last column of the UI.
For example, all terms that are often used early on in the corpus and whose usage then decreases may be clustered together as a “falling evolution” cluster. You can then select all terms in the cluster using the cluster control at the right end of the filter bar.
The Distant Reading interface gives access to several other modules for corpus exploration.
Reference
Wattenberg, I. Fernanda B. V. (2008). The Word Tree, an Interactive Visual Concordance. IEEE Transactions on Visualization and Computer Graphics. Volume: 14, Issue: 6 (online)
Video tutorial of the capacities of Distant Reading
Please also see a video demonstrating the capacities of Distant Reading:
 Cortext Manager Documentation