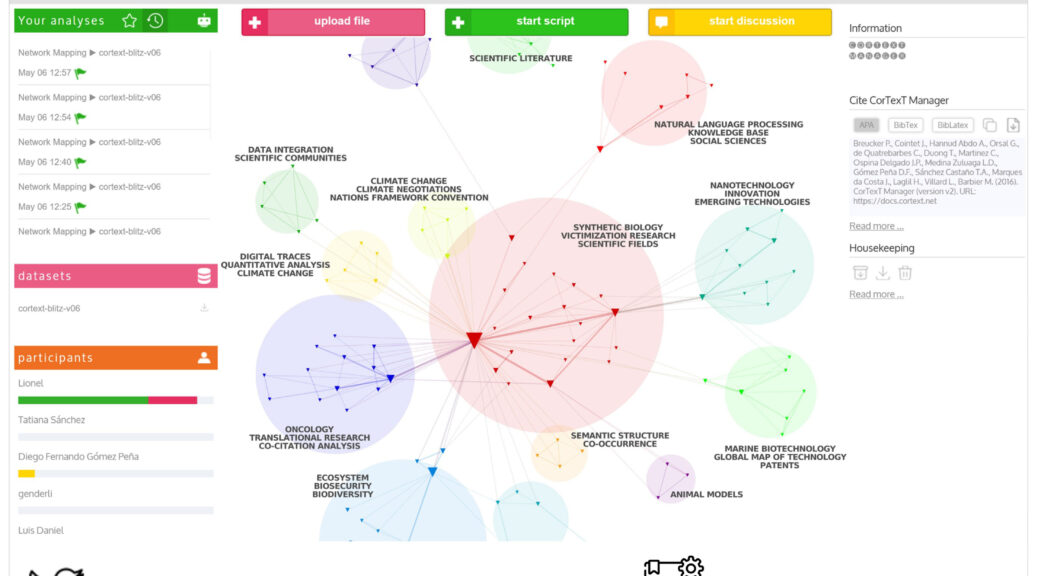
A wide variety of projects with different datasets and analysis scripts can be created in CorText Manager. Organizing and managing your work and your user space is essential: features have been developed over the years and also thanks to user community feedbacks. Find on this page a quick overview of the dashboard features.
Manage your projects
Information
By clicking on “Edit Project information”, you can modify the name of the project and add a description. Enter your text then click on “Save”.
Participants
Your project can be shared with one or several collaborators. Click on “+ invite a co-worker” then enter the user name of your collaborator. In case that your collaborator hasn’t created an account yet, you can send an invite by typing his email in the “+ invite a co-worker” section.
Your collaborators have the same rights and have access to the same functionalities as you in the project.
Start discussion
Use this button if you want to exchange with collaborator(s) of the project. An email will be sent automatically to your collaborator(s) to inform them of your post.
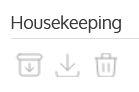
Housekeeping
Three buttons run different housekeeping tasks for the project:
- Archive this project: By clicking this button, you are no longer able to run new analysis scripts for that project. Scripts that have been run, files that have been uploaded and databases that have been created are no longer visible nor accessible in the dashboard.
In the ‘projects’ section of the CorText Manager home dashboard (listing all the projects you have created with your user account or for which you are a collaborator), archived projects are preceded by a star (*).
Note that you can un-archive a project, simply by clicking again on the icon in the housekeeping section of the project dashboard.
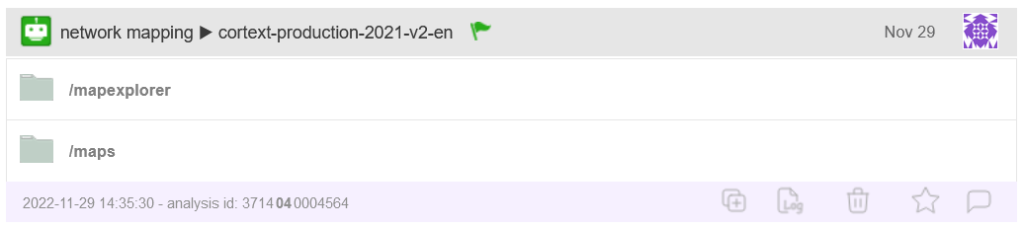
- Download this project: By clicking on this button, an exact copy of everything CorText Manager has from the project is created into a zip archive: The zip contains all the corpora, parsed datasets, resources (e.g. terms list, dictionary), comments, results files and visualisations of the project. To facilitate access and exploitation, the zip file content is organised into three folders:
-
-
-
- files: contains all files (corpora and resources) that have been uploaded into the project and all comments that have been done on the files.
- analyses: contains all analysis scripts that have been run in the project (i.e. files generated by CorText Manager, databases, and comments made on these analyses). The folder is organised by analyses (i.e. one folder is created for each script that have been launched).
- discussions: contains txt files for each discussion that have been created in the project (i.e. when the option “start discussion” of the dashboard was used).
-
-
-
Please note that some functionalities available on the web application (i.e. tools, some data visualisations, e.g. dynamical network analysis or distant reading) will not work while using this zip archive on a local environment. These tools and visualisations require certain resources located in the technical infrastructure of CorText Manager.
- Delete this project: This button completely removes the project from the CorText Manager infrastructure: everything this project contained has been deleted and the project is no longer accessible nor visible in your CorText manager home dashboard.
Be very careful with this action as there is no going back.
Note that the “delete” button can only be selected if the project has been downloaded at least once and if you are the only participant in the project. In case the project contains collaborator(s), you have to ask your collaborator(s) to quit the project before you can access to the “delete” button.
Be careful before deleting: you must re-download your project as soon as you have made any changes for saving an updated version.
Manage the analyses in your projects
Script’s entry
For each script launched, an entry is created in the project dashboard. The outputs and results are centralized in this entry.
 Entry created in the project dashboard after launching a script
The color of the flag at the top of the analysis’ entry indicates whether the analysis reach completion (green flag) or not (red flag).
At the bottom of each entry, five icons allow you to perform different actions:
- Relaunch script: Re-runs the exact same analysis on the same dataset. Using this button leads you to a new script page: the same parameters and the same database as the duplicated analysis are selected in this window.
Note that the database on which the script will be applied can be modified by clicking on “change corpus” (useful to apply a similar analysis on another dataset of your project). The parameters can be modified (useful for example to replicate an analysis on the same corpus by modifying only one parameter).
- See logs: gives access to the execution log of the script. Useful to have a summary of the parameters that have been chosen for the analysis.
In case the analysis has not reach completion, the last line of the log should provide some explanation to help you solve the issue or to report it in our forum. - Delete element: deletes the analysis from the project. Note however that the outputs related to the analysis that have been created in the database of the project are not deleted. If you want to delete these outputs in the database, please use data curation.
- Mark as favorite: Highlights the analysis. This icon has been designed to help you quickly find in your project dashboard the analyses that are important or those for example that will be kept for your publication.
The “Your analyses” section at the top left of your project dashboard offers a summary of the scripts launched in your project. By clicking on the “hour” icon, the displayed scripts are the last 20 that have been launched in your project. By clicking on the “star” icon, the displayed scripts are the ones you have pinned and identified as important.
Note that if you click on any of the analyses summarized in ‘Your analyses’ section, the dashboard will automatically position itself on that analysis.
The “star” icon can be unclicked if the analysis no longer needs to be highlighted (can be unclicked in the “Your analyses” section or in the analysis entry in the dashboard).
- Comments: Add as much comments as you need. Comments are dated and their author identified. An email will be sent automatically to your collaborator(s) to inform them of your post. Comments can be deleted by using the “trash” icon.
Filter analyses in the project dashboard
Analyses of your project can be filtered using the dashboard search box: enter a script type in the bar to display only the entries corresponding to this analysis.
In case your project contains several datasets, you can click on one of them in the “datasets” section of the dashboard. The latter will then display only the entries of the analyses that have been run on this dataset.
In the same way, if you are several collaborators in the project, it is also possible to list only the analyses launched by one of the project members. To do this, click on the user name in the “participants” section.
Note that it is also possible to filter the analyses by dataset and by user name, by clicking on the two sections.
 Cortext Manager Documentation