This page describes the principal options under the dynamics panel in the mapping script.
If your corpus has time series data, you may want to define periods and produced an alluvial diagram (Rule et al., 2015).
Defining time periods
Network mapping script also enables users to divide a corpus according to their need. One can work with custom initial time ranges (as defined by period slicer script) or with standard periods (typically a yearly defined corpus).
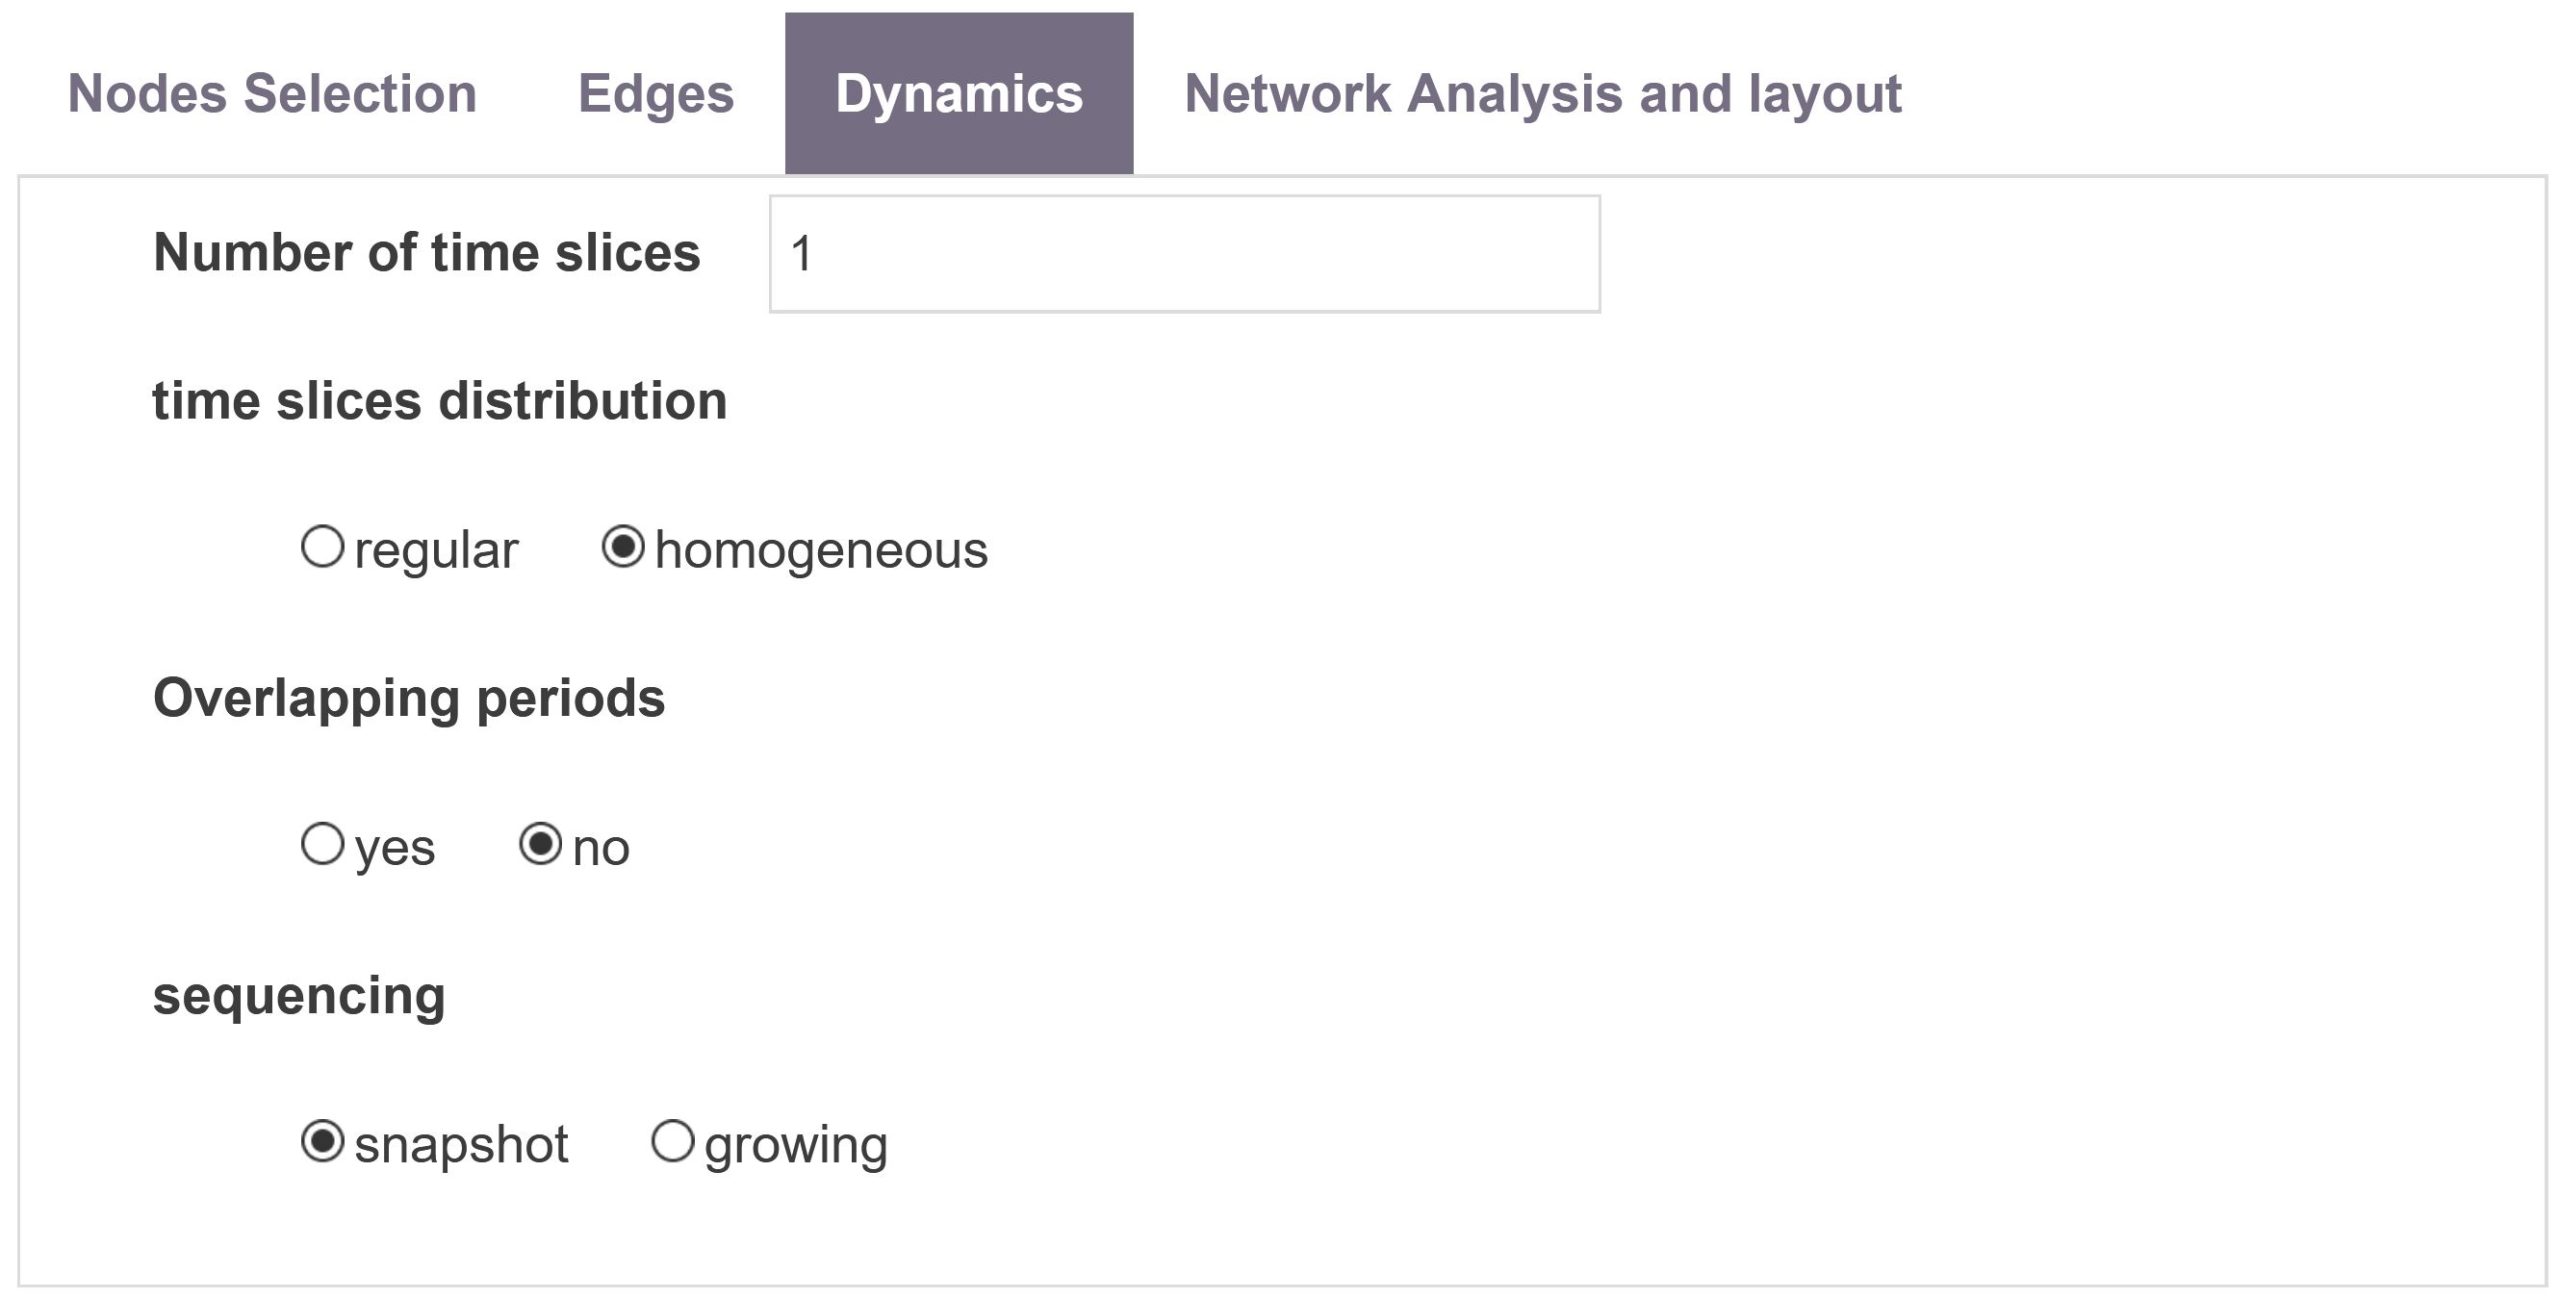
Number of time slices
You are then asked in how many slices you wish to divide your corpus.
If you want that the different sub-parts to be equal regarding the number of years (regular) or regarding the number of documents (homogeneous). Each time period will be assigned a sub-corpus gathering all documents produced during this time range from which a specific analysis will be build. By default, periods are sliced to produce a partition of the corpuses overall timespan.
Overlapping periods
However when overlapping periods is activated, time slices intersections are not empty anymore. One time period will intersect with its preceding and succeeding time periods such that half of the time steps or half of the records (if homogeneous slicing has been selected) are shared with either of them.
sequencing
Snapshot mode consists of successive periods, possibly overlapping, growing mode will create periods starting from first time-step with increasing length.
Intertemporal analysis advanced settings
Find in the Network Analysis & Layout options panel, some advanced parameters to fine-tune the behaviour of the intertemporal analysis and its layout:
- Automatic Intertemporal Threshold
- Intertemporal threshold minvalue
- Intertemporal threshold max
- Small cluster Embedding in the river network (not in the initial methode described in Rule et al., 2015)
- Hide orphan clusters in the phylogeny
- Normalize river network
Alluvial diagram of the temporal evolution
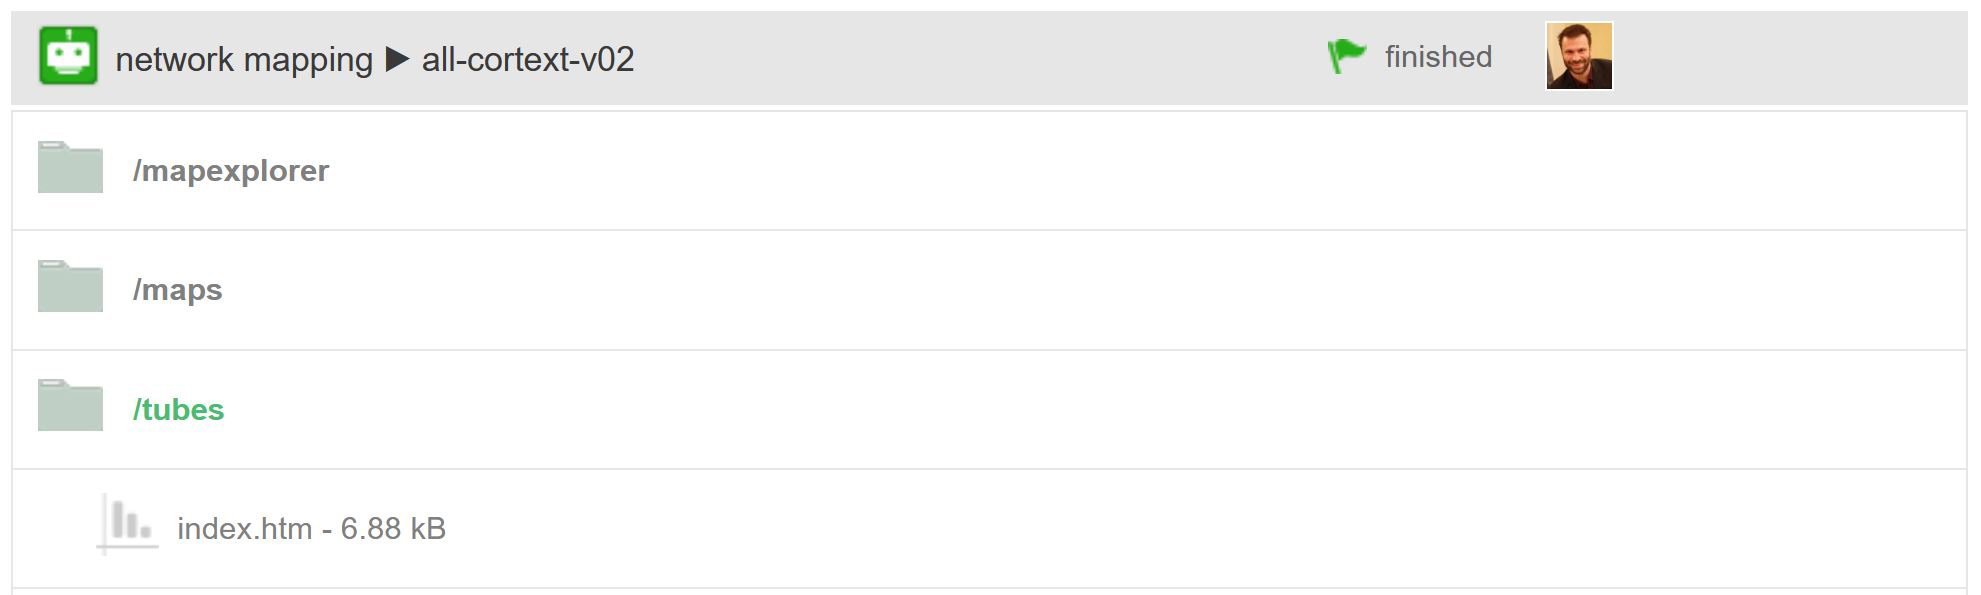
Whatever the slicing strategy, if several time periods have been selected, the script should output both the set of maps drawn at each time period (click the maps directory in the results pages) and the tube layout representation of clusters transformations in time: click the tubes directory in the results pages and on the eye icon at the right of index.htm line.
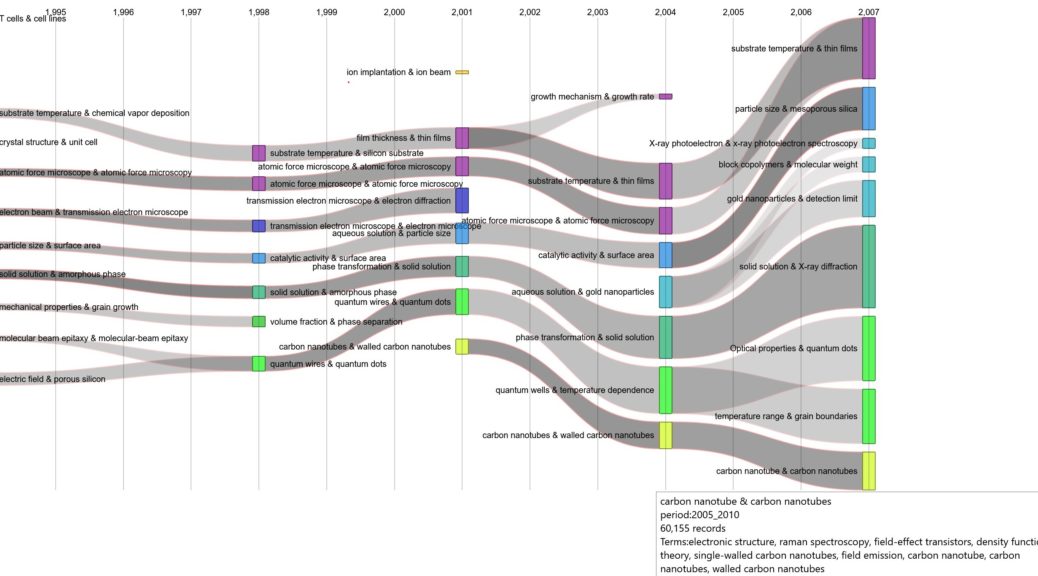
The “tube layout” representation is fully interactive (example). The width of tubes is proportional to their number of records. Darker tubes are also more robust (more nodes are shared between two consecutive time periods). Simply hover over a cluster to learn about its composition. Note that colors in tube layout are consistent with the ones used for coloring maps.
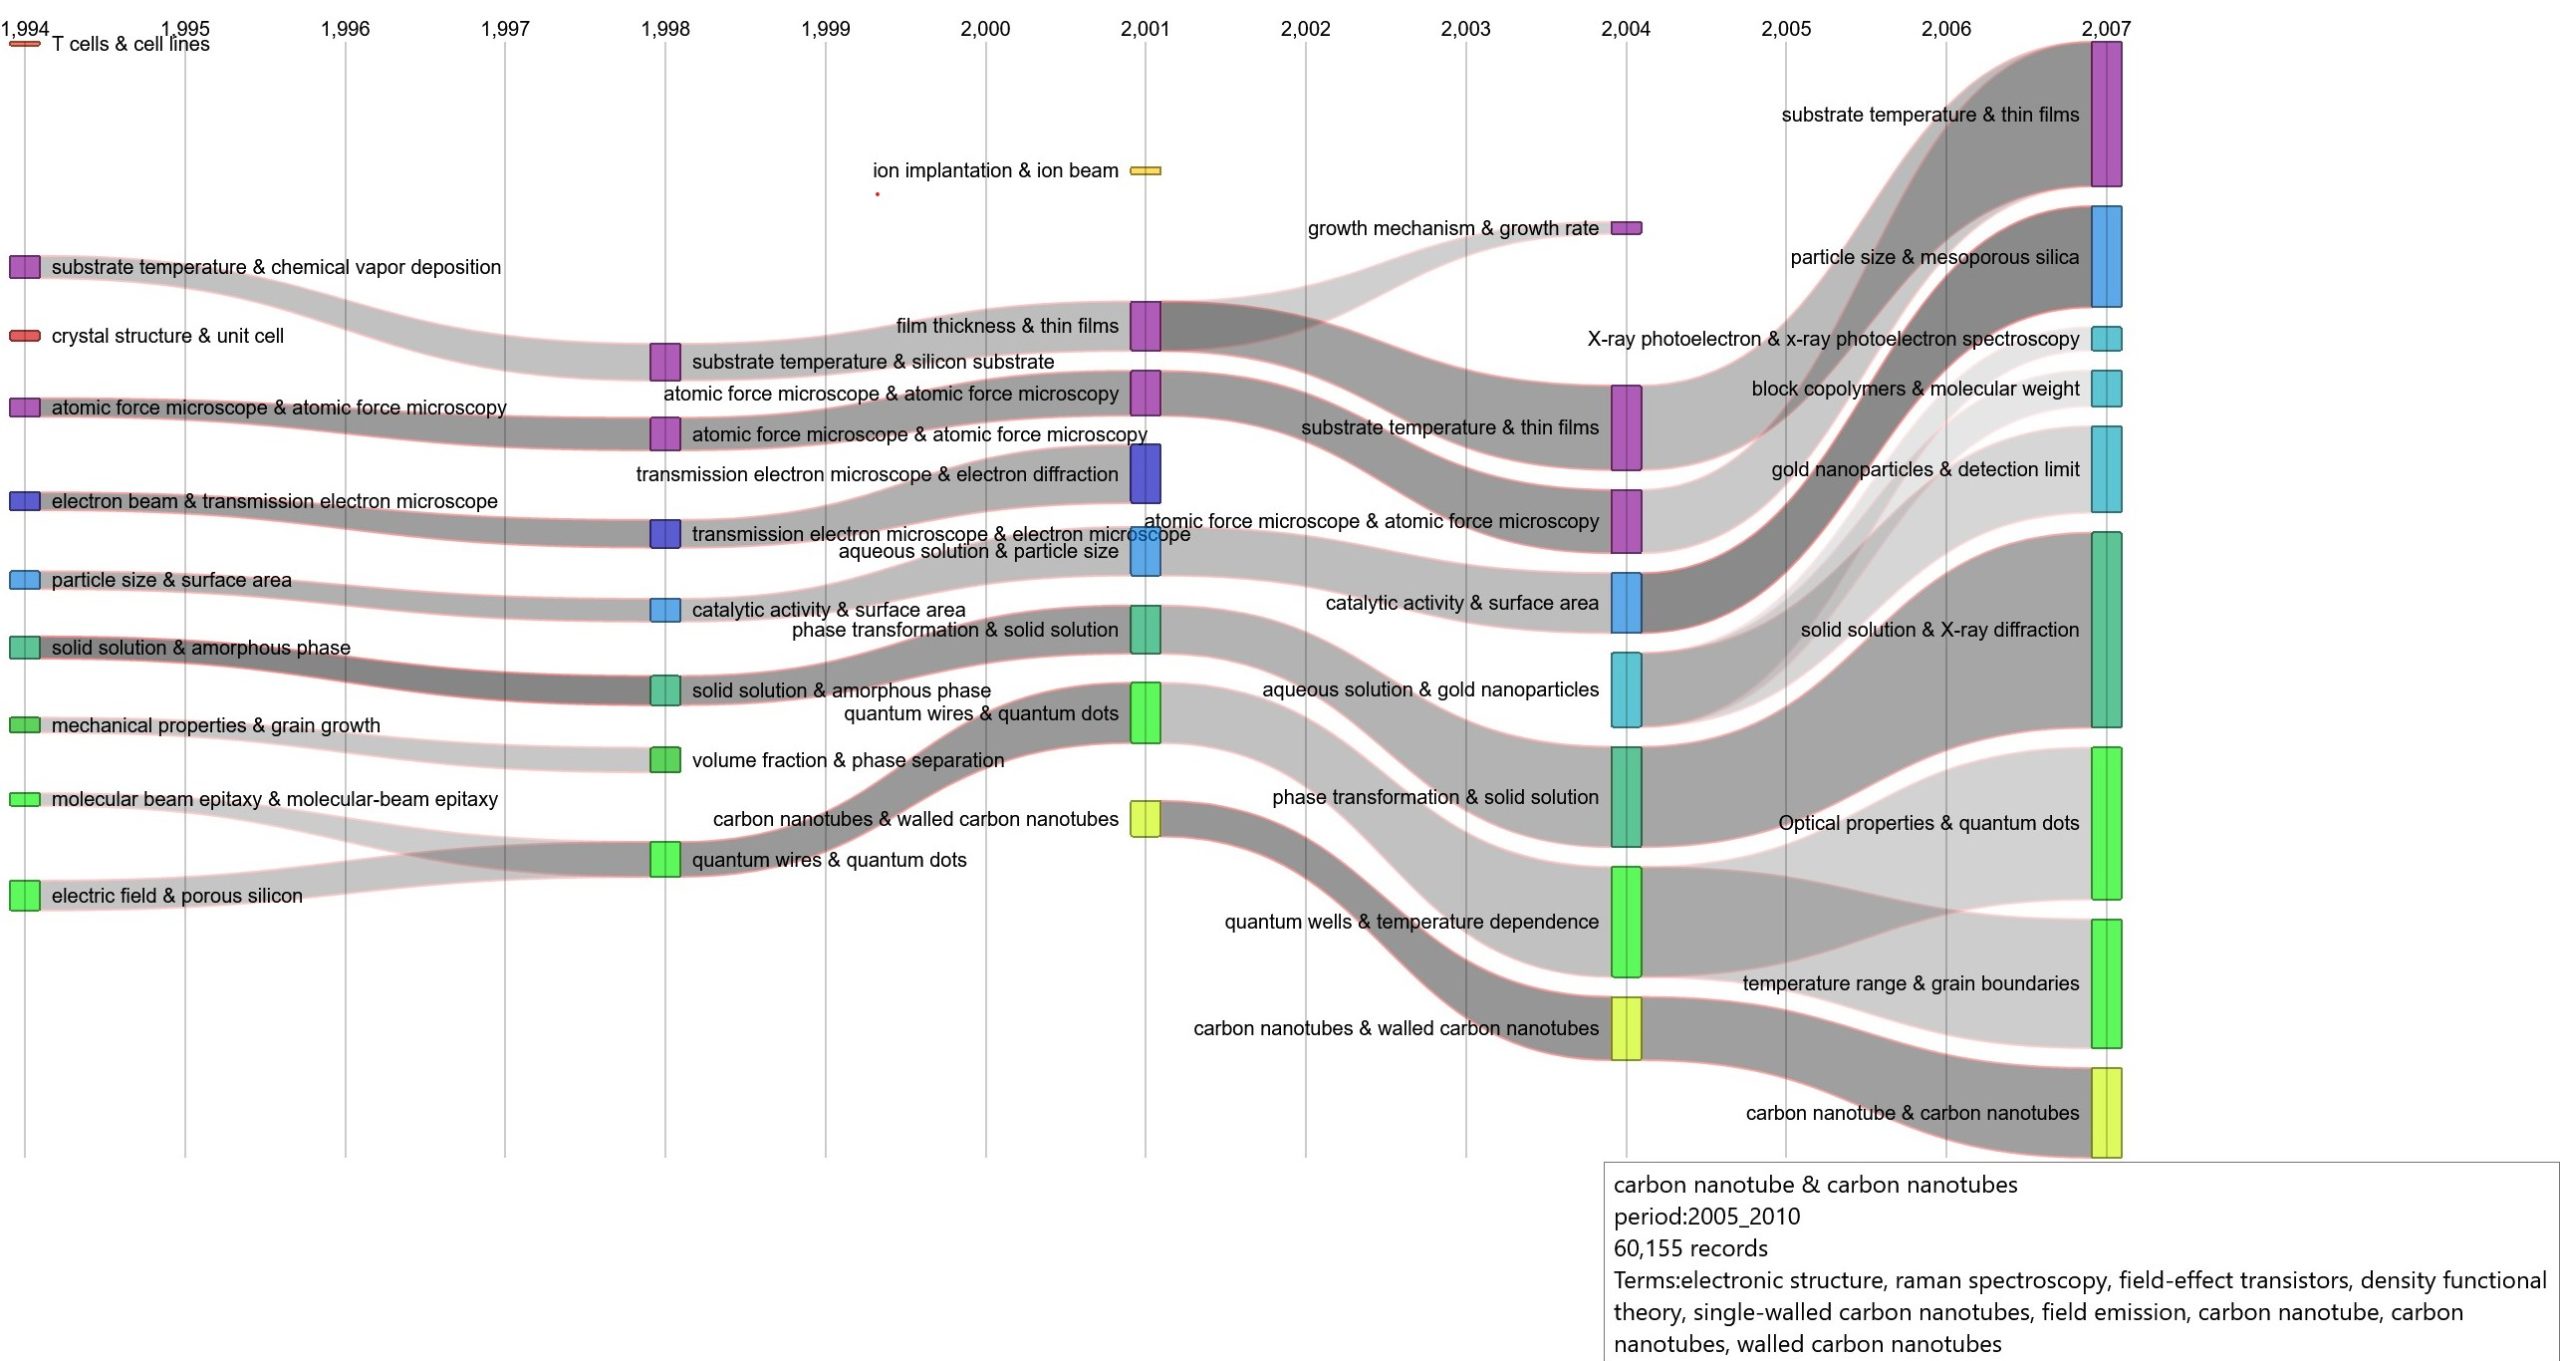
Understanding intertemporal stenghts
In the Tubes Layout (Sankey diagram), Cortext Manager represents each period as a set of clusters (communities of terms) and connects clusters across periods when there is evidence of thematic continuity. When you hover the mouse over a cluster “dot” or over a tube segment, it displays additional information.
The list of terms shown for a cluster
When you hover over a cluster dot, it displays a list of terms intended to summarize what the cluster is “about”. For interpretation, you can think of this list as a local description: it indicates the vocabulary that is associated with the cluster in that period.
What “strength” means on a tube segment
When you hover over a tube segment connecting two clusters from two periods, Cortext Manager displays a value called strength. This value indicates how strongly the two clusters are related across time.
Strength is a measure of semantic continuity between the two connected clusters. It quantifies how similar the two clusters are in terms of their internal distribution of terms.
More concretely, it represents each cluster as a distribution of term weights (you can think of it as a thematic “profile” of the cluster). The strength of the link is then computed as a distributional similarity between the two profiles, using a metric derived from the Hellinger distance (Hellinger, 1909).
Reading the strength value
The value labeled strength indicates the degree of semantic continuity between two clusters connected by a tube. It can be interpreted as follows:
- Strength ≈ 1: the two clusters are almost identical. Their thematic profiles are very similar, indicating a very strong continuity over time.
- Strength ≈ 0.7–0.9: strong thematic continuity. The core vocabulary remains largely stable, even if some secondary terms may change or be reweighted.
- Strength ≈ 0.4–0.6: partial continuity or recomposition. The clusters share a common thematic base, but significant shifts, drifts, or internal reconfigurations of the vocabulary can be observed.
- Strength ≈ 0: weak continuity or rupture. The two clusters share little in terms of their distributions of terms, suggesting a thematic break. Such low intertemporal strength values are typically filtered out. Importantly, filtering applies to intertemporal links, not to clusters themselves: clusters remain visible at each period, but weak or non-meaningful connections between periods are not displayed.
For interpretation, strength can be read as a quantitative proxy for the idea that a topic persists over time, even when it may be reconfigured. It helps distinguish stable thematic lineages from more episodic or fragmented ones.
The strength values are filtered using the following parameters
- Automatic Intertemporal Threshold (yes, by default): when enabled, it automatically estimates a threshold value in order to retain the most meaningful intertemporal links.
- Intertemporal threshold minvalue: defines the minimum strength required for an intertemporal link to be displayed. Links with a lower strength are filtered out.
- Intertemporal threshold max: defines an upper bound on the strength values to be considered, allowing users to focus on a specific range of intertemporal similarities.
The “shared” list on a tube segment
When hovering over a tube segment, it also displays a list introduced by shared: these are the terms that appear in both clusters connected by the link. The shared terms correspond to the vocabulary items that appear in both clusters connected by the link. They provide a qualitative indication of lexical overlap between the two clusters.
Temporal direction and period-by-period clustering
The Tubes Layout (Sankey diagram) is designed to represent semantic continuity between clusters across
successive time periods.
Temporal direction: Cortext Manager links the present to the past (T to T−1)
Cortext Manager proceeds retrospectively: for each cluster at a given period T, it searches for its closest antecedents in previous periods (T−1).
In substantive terms, the algorithm answers the question: “Which earlier clusters can be considered as antecedents of this cluster observed at time T?”
This is a genealogical logic of inheritance (present clusters “attach” to past configurations), rather than a forward-looking prediction of what a cluster “becomes” in the future.
Clustering is computed independently within each period
A crucial point for interpretation is that the clustering step itself is not dynamic in the sense of a model where clusters at time T would constrain or modify clusters at time T−1 (or vice versa).
Instead, for each period:
- a network is built for that period (based on the chosen proximity measure and filtering settings);
- a community detection algorithm (e.g., Louvain and variants) is applied to that period’s network;
- the resulting set of clusters is stored as the clustering solution for that period.
Implication: clusters in period T and clusters in period T−1 are obtained as two separate partitions. The intertemporal step does not re-cluster” earlier periods, and the clustering at T does not retroactively change the clustering at T−1.
Strength is symmetric, but the selection of intertemporal links is directional
The Hellinger-based similarity is symmetric. This means that, for a given pair of clusters, comparing “T vs T−1” yields the same strength value as comparing “T−1 vs T”.
However, while the similarity score itself is symmetric, the selection of links that appear as tubes is not purely symmetric, because Cortext Manager uses a directional matching procedure:
- for each cluster at time T, the algorithm evaluates candidate antecedents in T−1;
- it retains only those links above a user-defined (or automatically-defined) intertemporal threshold and/or selects a best parent depending on the chosen parameters;
- additional heuristics can be used to refine how recombination patterns (fusions and splits) are identified and represented, following a logic explicitly formulated as current cluster to past antecedents (see: intertemporal analysis advanced settings above).
Implication for interpretation:
- Strength tells you how similar two clusters are in content (a property of a pair of clusters).
- The tube structure (which links are kept, how many parents a cluster receives, how fusions are represented) depends on the
direction of the matching procedure, because the algorithm is built to attach each current cluster to its most plausible past antecedents.
In practice, this means that the Sankey view should be read as a genealogy of themes: clusters are formed independently within each period, then intertemporal links are selected to represent how each present configuration connects to previous ones.
Role of overlapping periods
Because lexical change over time is a continuous rather than a strictly sequential process, and because it depends on corpus size, the nature of the topic, and the type of data used (e.g. bibliographic records or social media data), it may be useful to construct overlapping time periods. In this case, each period (T) structurally overlaps and shares part of its vocabulary (i.e. documcents) with periods T−1 and T+1, which can strengthen the detection of intertemporal semantic changes.
See: Overlapping periods parameter above.
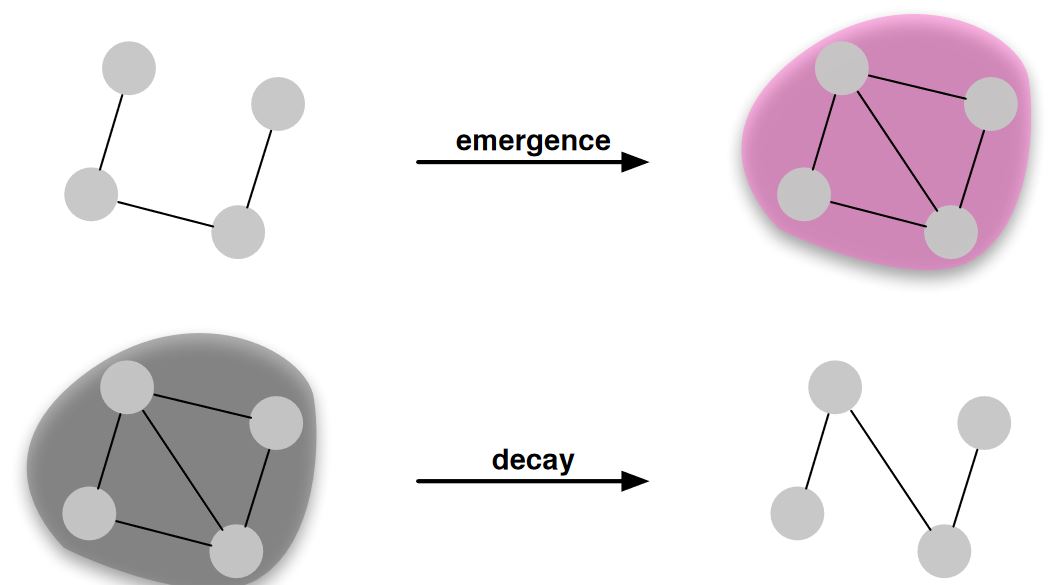
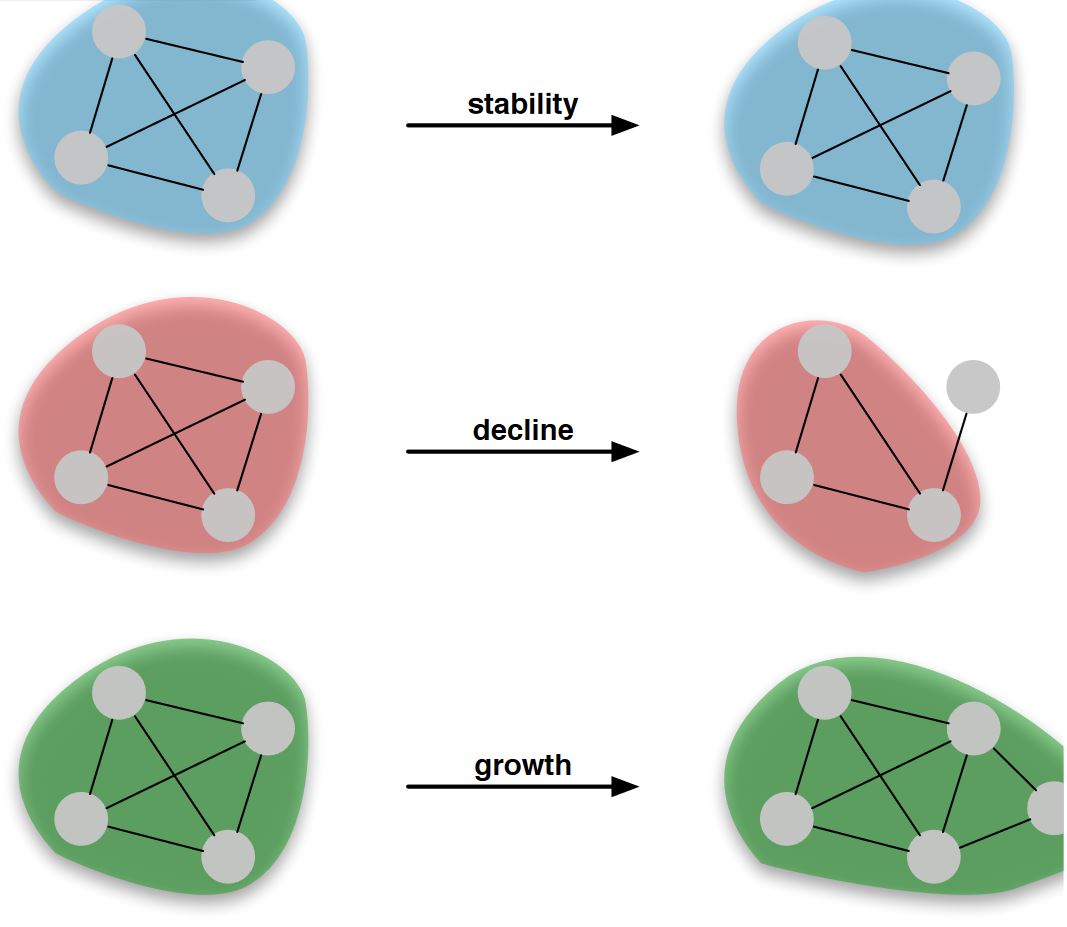
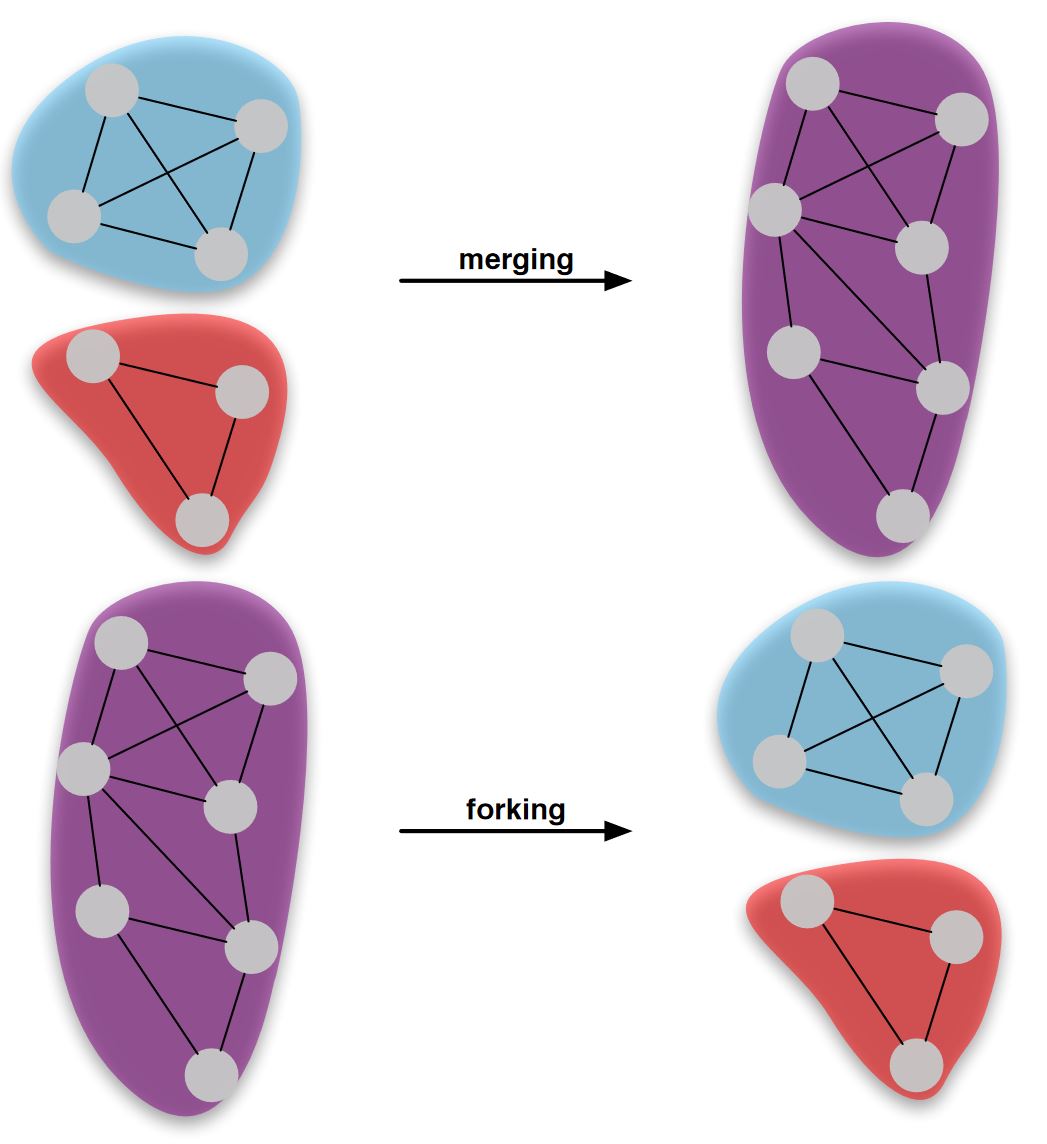
Tubes life cycle at mesoscopic scale
Birth and death
Maturing
Meet or separate
References
Rule, A., Cointet, J. P., & Bearman, P. S. (2015). Lexical shifts, substantive changes, and continuity in State of the Union discourse, 1790–2014. Proceedings of the National Academy of Sciences, 112(35), 10837-10844.
Hellinger, E. (1909). Neue Begründung der Theorie quadratischer Formen von unendlichvielen Veränderlichen. Journal für die reine und angewandte Mathematik, 136, 210–271.
 Cortext Manager Documentation