Correspondance analysis provides original visualizations of factor analysis as computed using FactoMiner library in R (see how to cite this work below).
Correspondance analysis parameters
The parameters are quite intuitive.
id Fields
First one has to decide on the nature of individuals that will be considered to build the Burt matrix. For a bibliometrics analysis, one could work at the level of individuals, institutions or papers for instance.
Fields
Then the active variables should be entered (as many dimension as needed).
Supplementary Fields
Finally the last option allows to also include supplementary variables : project on the MCA but that will not take part to the definition of the axes of the factor analyze.
Number of nodes
Number of top nodes to consider in each field. Nodes with smaller values will be ignored.
Interactive visualizations produced
Three interactive visualizations are released. They are all bi-dimensional and show the positioning of variable modalities along the three first dimensions.
- The first html file shows dimensions 1 and 2.
- The second html file shows dimensions 2 and 3.
- The third html file show dimensions 1 and 3.
Finally the fourth html file codes first and second principal component on the x and y axes and use color for the 3rd component. Other files are produced containing the detailed positions and contributions of each variable to the correspondance analysis.
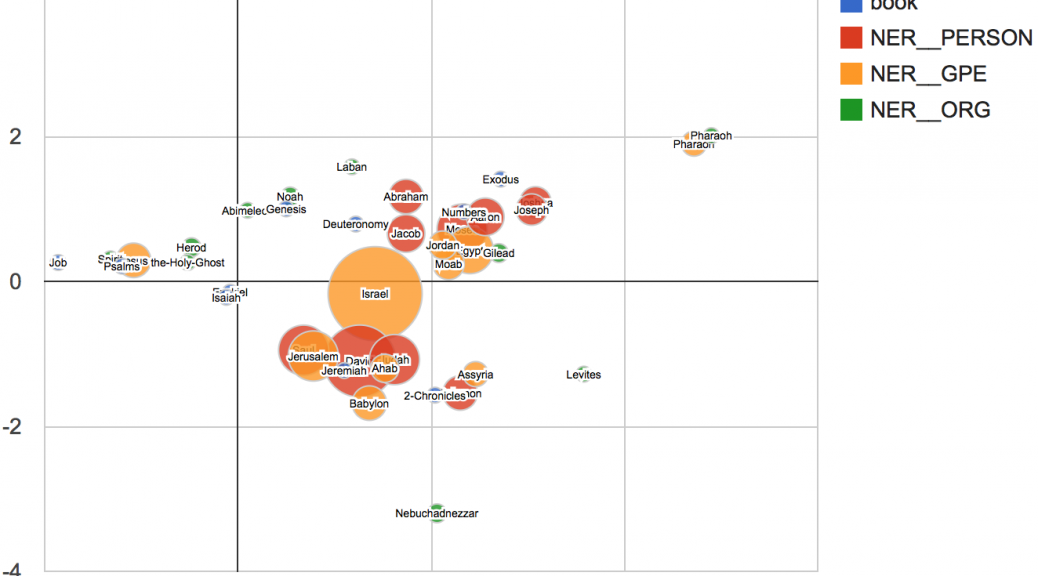
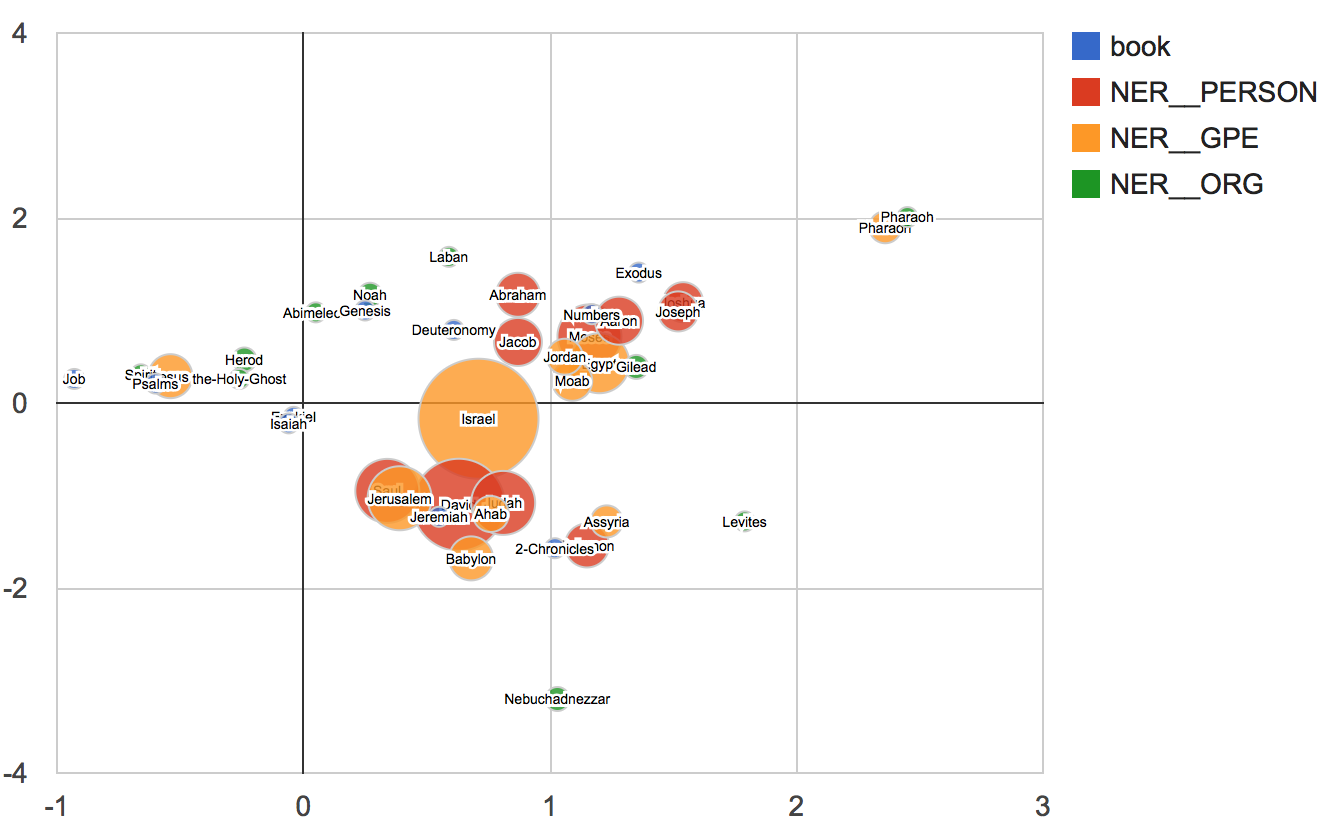
As an illustration, see the result of a correspondance analysis mixing named entities extracted from the bible:
References
Lê, S., Josse, J. & Husson, F. (2008). FactoMineR: An R Package for Multivariate Analysis. Journal of Statistical Software. 25(1). pp. 1-18.
 Cortext Manager Documentation