Demography processes each field of the corpus and counts the raw evolution of occurrences of the top items. You will simply be asked to specify the number of top items you wish to evaluate. If you previously customized periods, you can also optionally choose them instead of the original time stamps.
The script creates two directories called “global distributions” and “temporal evolution”.
- The first directory “global distribution” simply lists the distribution of items per document and the distribution of documents per item of each field. Those files are useful in order to understand – for instance – the distributions of the number of authors per article or number of papers written by authors in a scientific database (by selecting the Authors field). Note that distributions are computed over all possible entries in the database, thus ignoring the number of top items to consider.
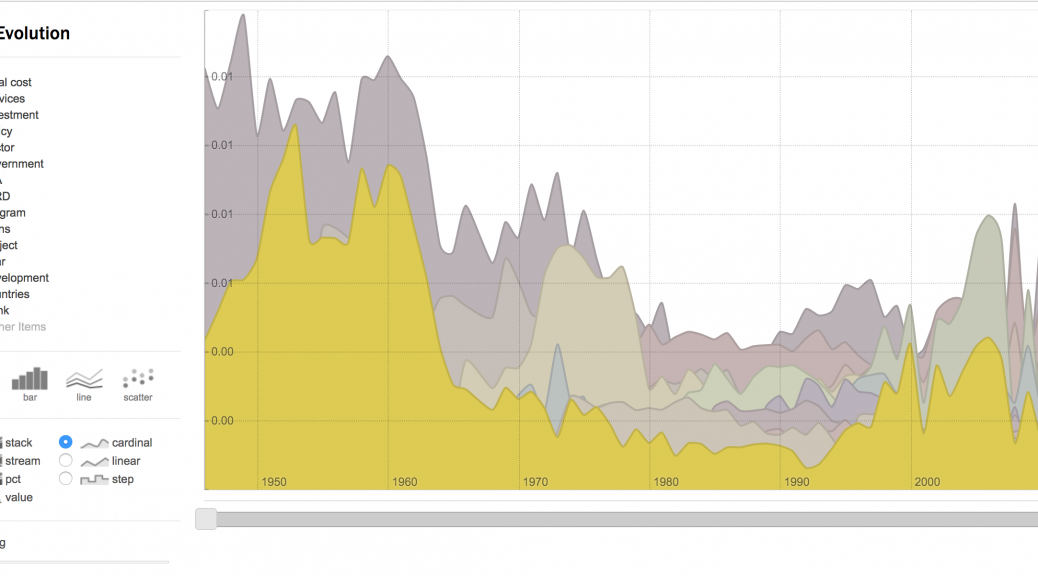
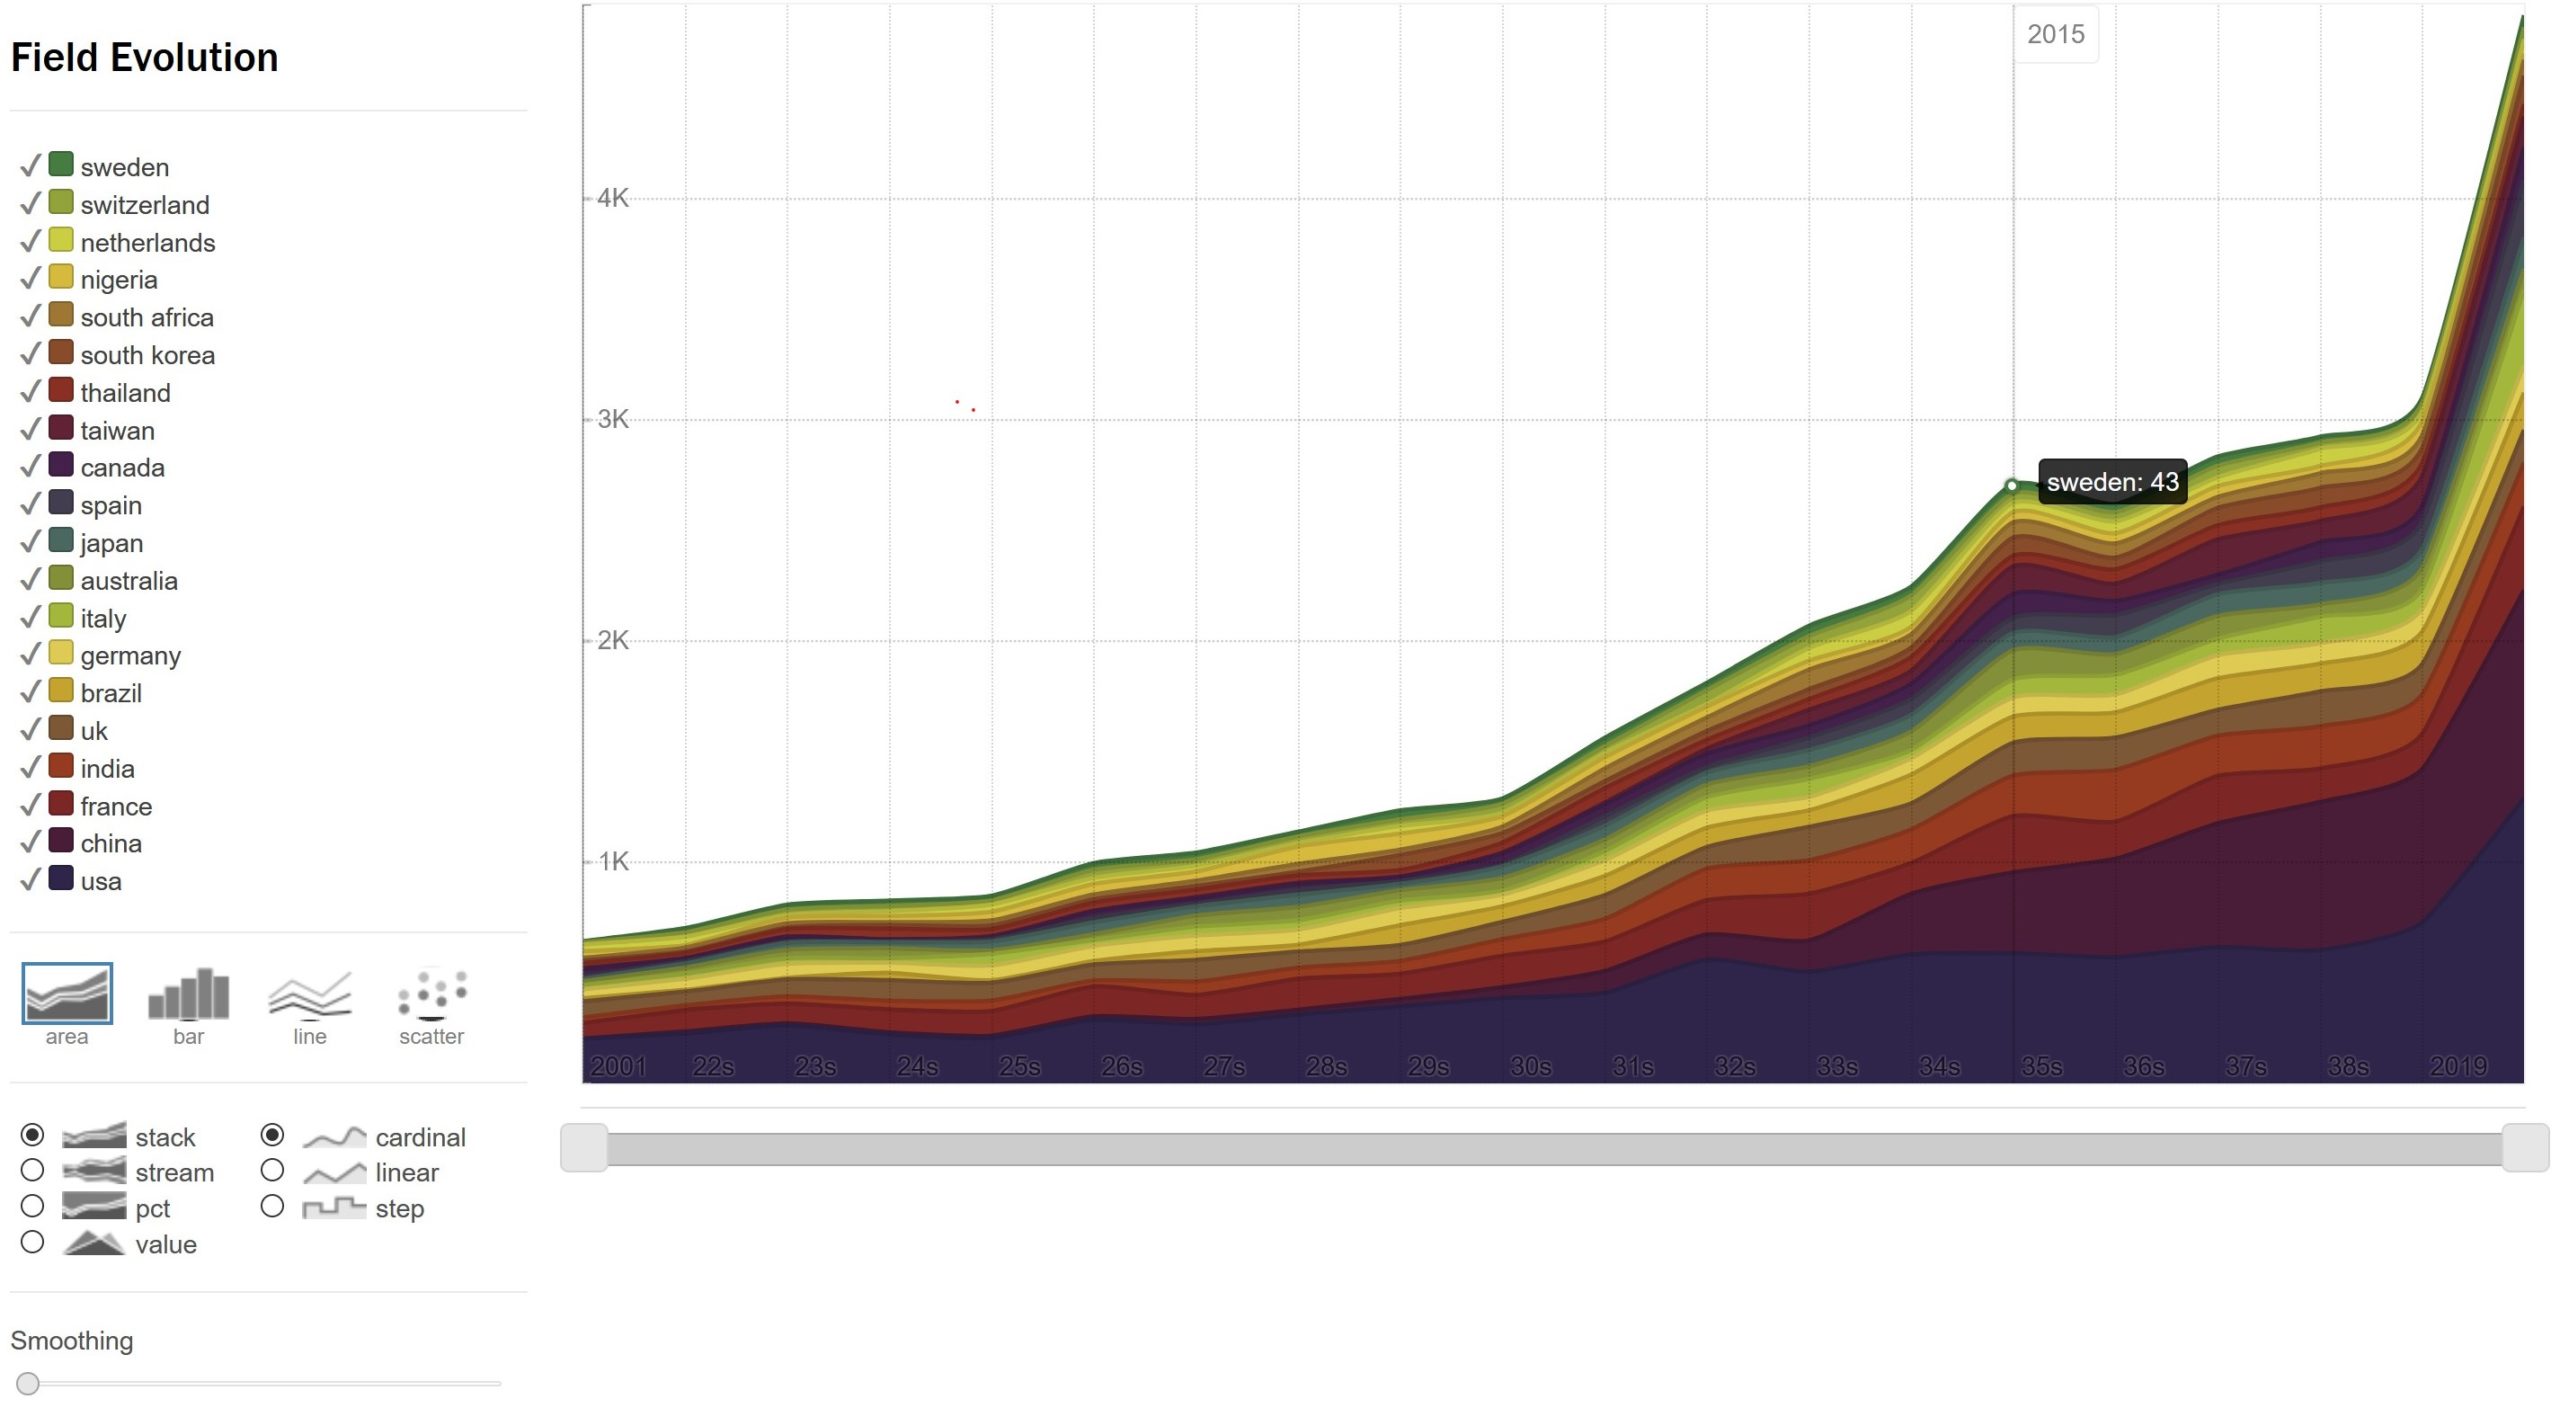
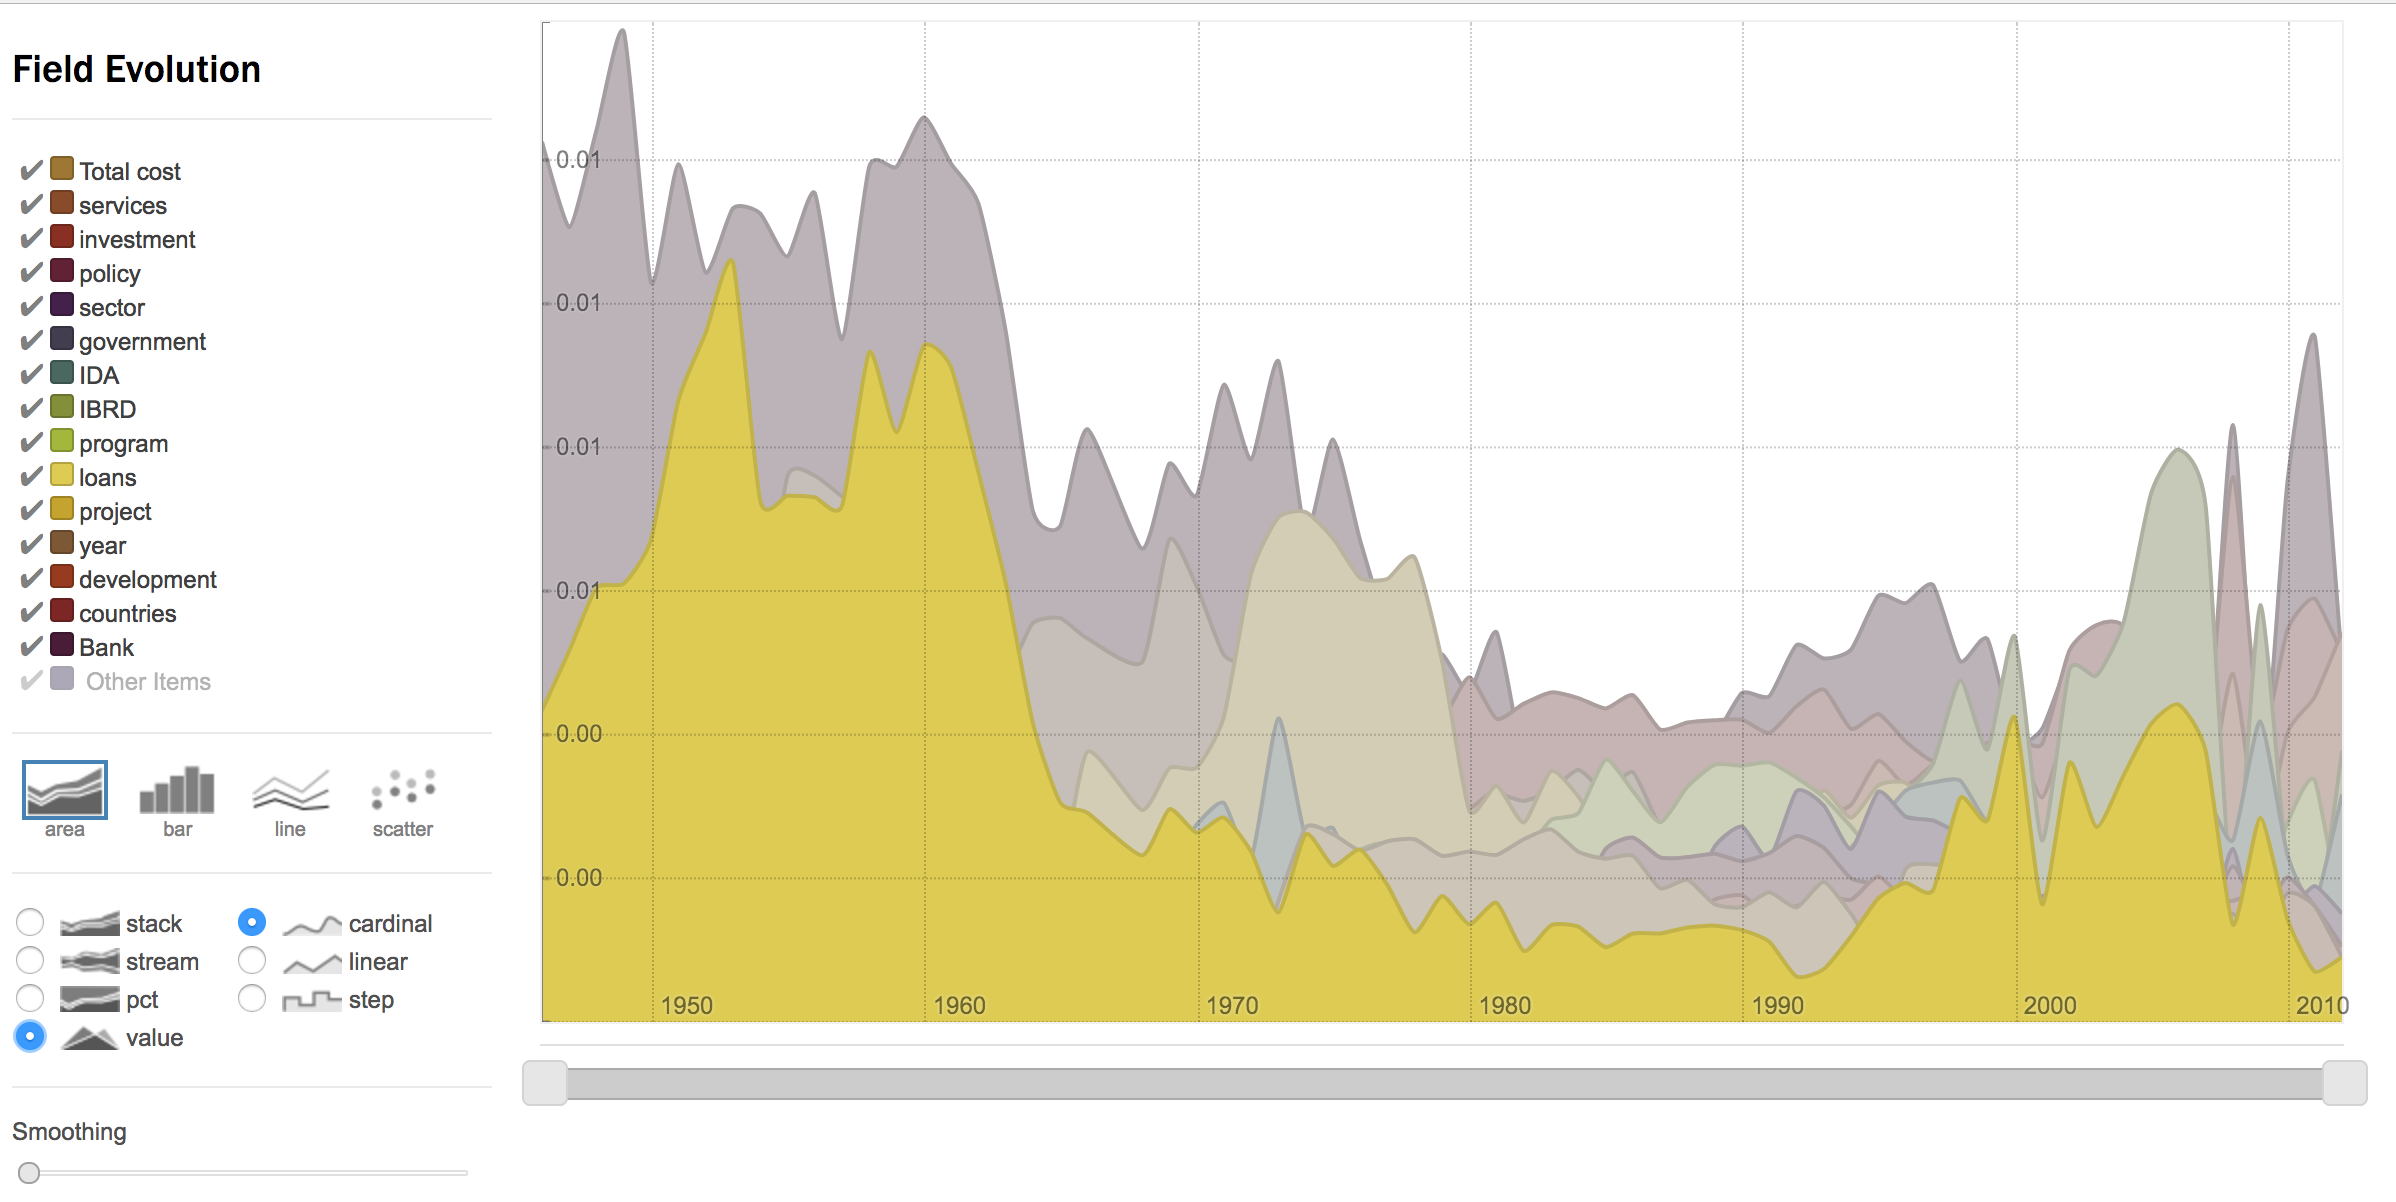
- In the “temporal evolution” directory, each field of the corpus will be enumerated over time in a csv file compiling the occurrences at each time step of the top items of the given field (original count of occurrences averaged over 3 or 5 time-steps windows are also available for analysis if raw statistics are too noisy). A dedicated web interface (see illustration) is also provided by clicking the eye next to the html files to visualize and customize the chart of each chosen field.
Demography main parameters
Which variable(s)?
Choose which variable(s) to use.
Is the variable categorical or numerical?
Categorical variables (default choice) will be counted at each time step, Numerical variables will be sumed (or averaged if normalization is activated).
Advanced Settings for Numerical
Normalize the scores by the number of documents at each time step
If activated (yes), the outcome time series will show the average score over the documents published on the same time step, otherwise the sum will be computed (no, default value).
Advanced Settings for Categorical
Select categorical entities
Number of top entities to consider
Choose how many top items to consider for each selected variable(s), sorted by their total frequency.
Include the cumulated count of all the remaining less frequent entities
This option allows to include the cumulated count of all the other (less frequent than the top N entities) in the result. If yes, the final visualisation will include the cumulated dynamic profile of all the other entities present in the field. It is useful to estimate which proportion of the data is covered by the top N entities.
Normalize raw frequency count
If yes, choose between the two types of normalisation below.
Normalize the count of each category by the number of documents or their length?
You can normalize the counts of categories by the number of documents in the database at a given time step or the cumulated length of a text field your entites were extracted from at a given time step.
number of documents
Use the number of documents per categorial values at a given time step.
text field length
This option is only useful when analyzing textual entities that were indexed from an original raw textual content. Raw counts of occurrences of entities is replaced by a score that corresponds to the raw frequency of entities divided by the length (in number of words) of the texts from which entities were extracted (at a given time step). More precisely, the score is made of the ratio between term frequency, and length of all the textual fields (measured in number of characters) multiplied by 6 which corresponds to the average size of words in english.
From which textual field(s) were your entities extracted?
Choose the field on which the normalisation by text field length will be computed. Multiple selection is possible.
Example of results
See this simple result for most pertinent words extracted from world bank report as an example of “Other Items” and “normalization” options:
 Cortext Manager Documentation