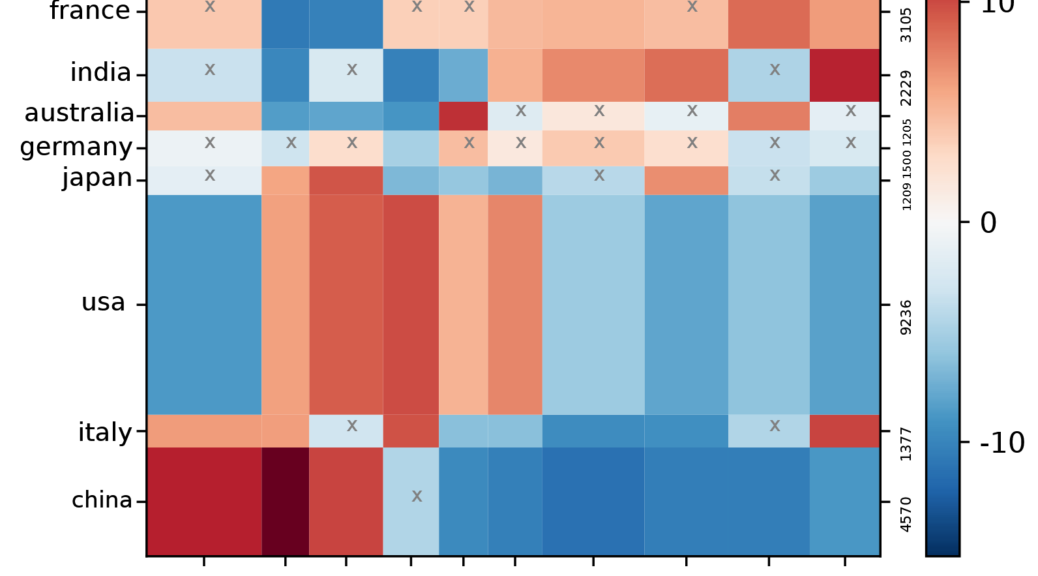
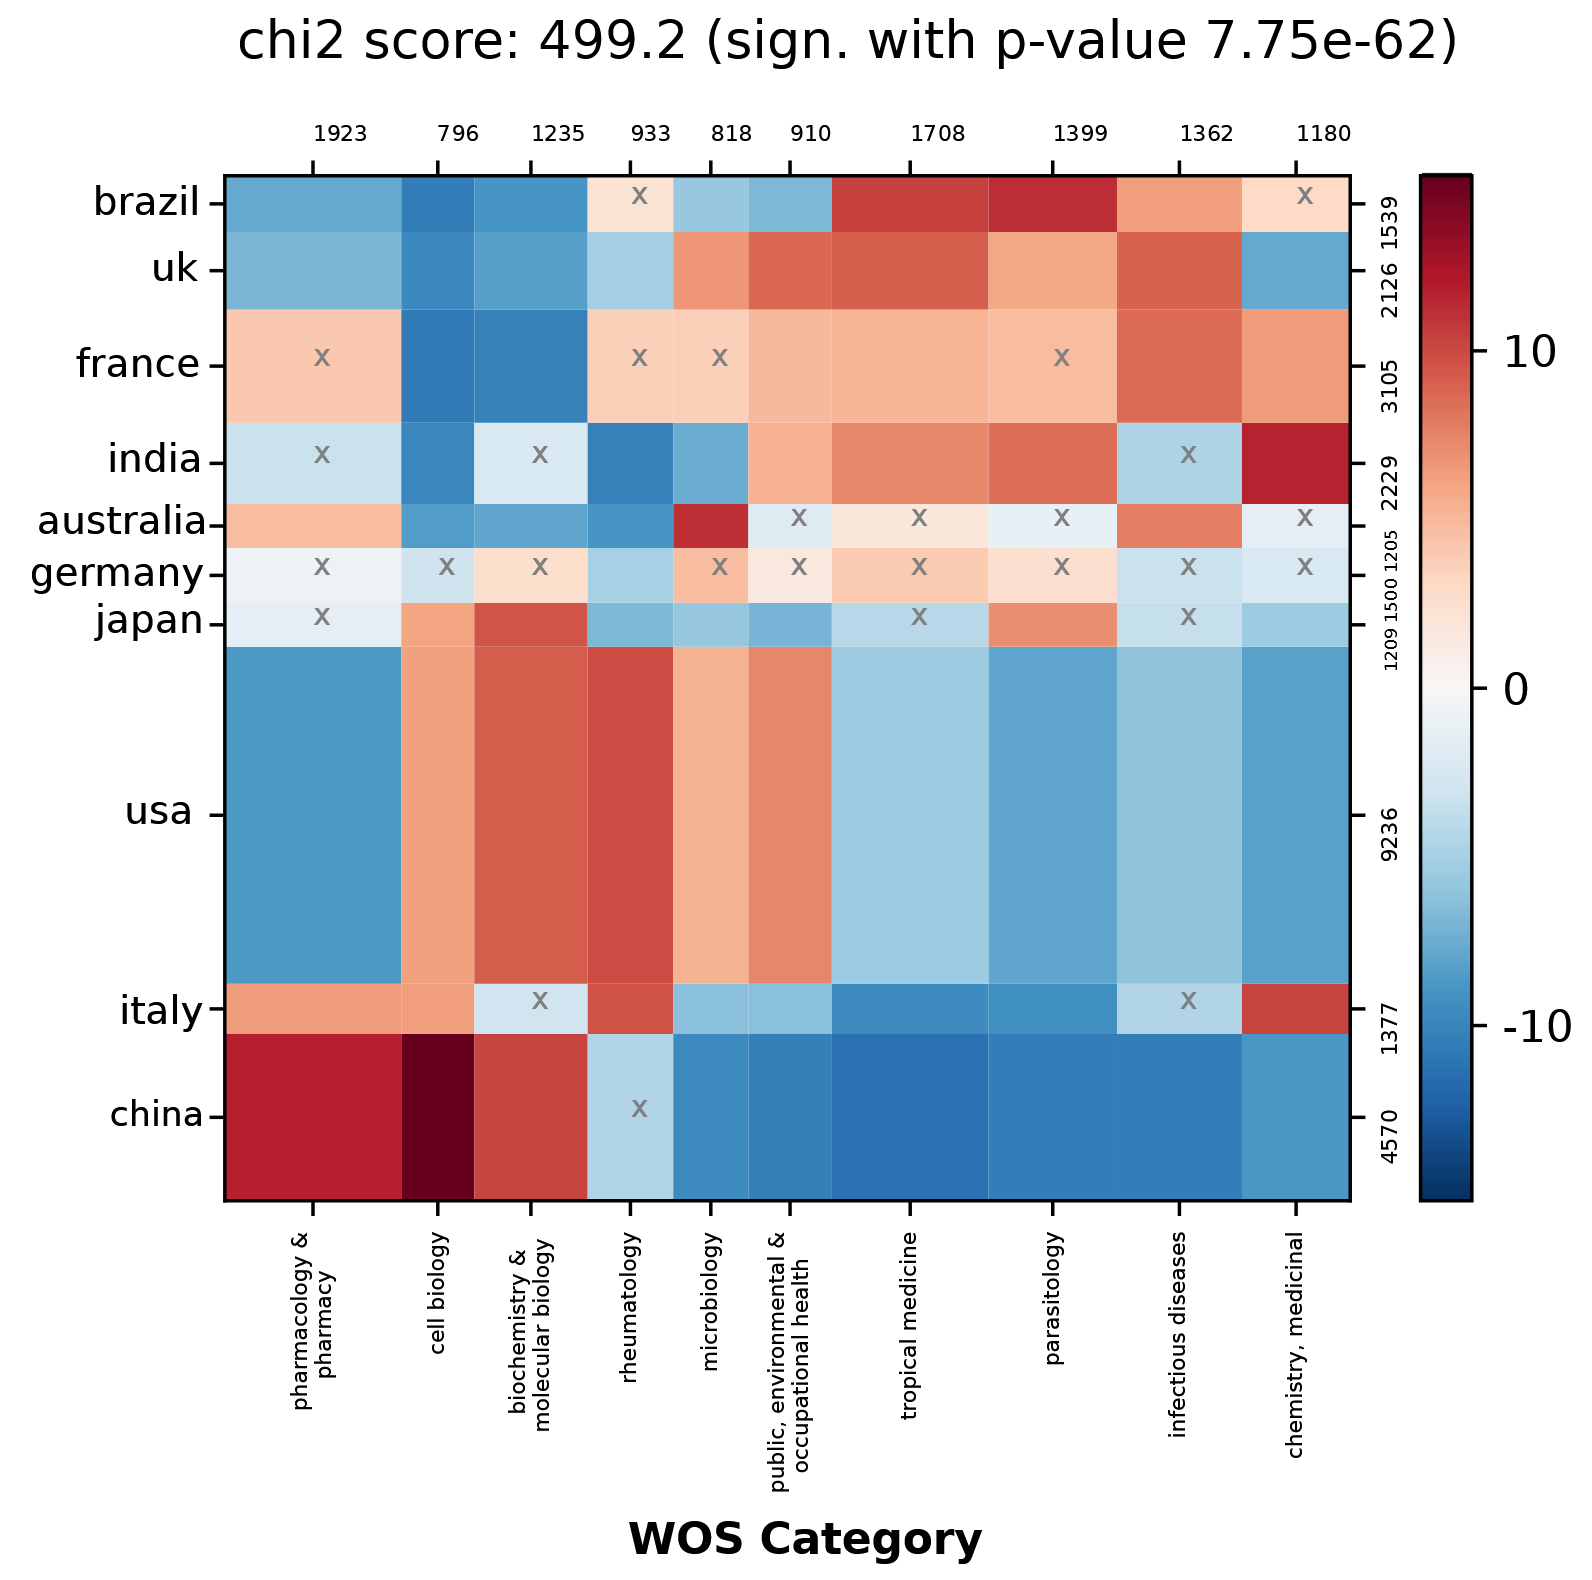
This script proposes to visualize the joint distribution of two fields, later denoted A and B, over documents in your corpus. The contingency matrix shows the degree of correlation between any pair of items A(i) and B(j) drawn from each chosen fields A and B. Red cells are the most correlated (many documents mentioning item A(i) also mention B(j)). Blue ones are anti-correlated (few documents mentioning A(i) also mention B(j)). White cells do not feature any correlation (B(j) and A(i) joint mentions are neither more nor less numerous than average).
Its parameters are defined in 4 different panels which are largely similar to the options proposed in the network mapping script. However, no network is plotted. Instead, a visualisation of the contingency matrix is produced.
Contingency Matrix visualisation
Contingency parameters
Nodes selection
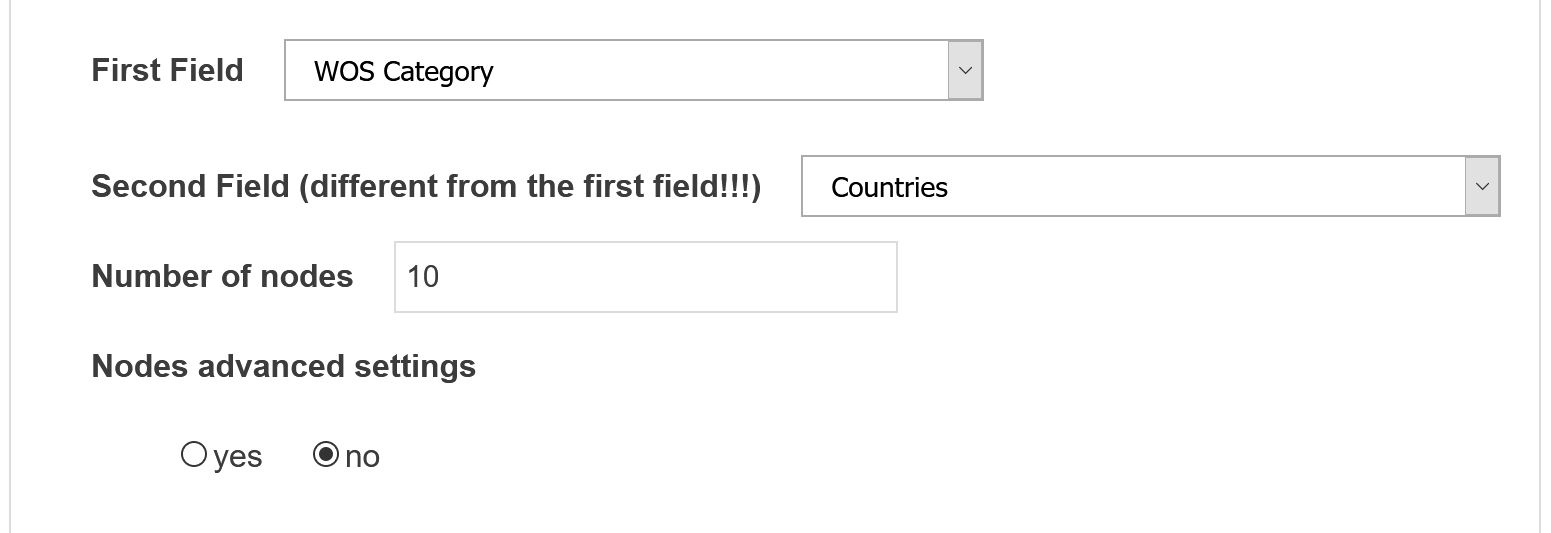
First Field
Define the first field from which the nodes will be selected. It will populate the x-axis.
Second Field
Different from the first field! Define the second field from which the nodes will be selected. It will populate the y-axis.
Number of nodes
Number of top nodes to consider in each field (max=100).
Contingency matrix measure strategies
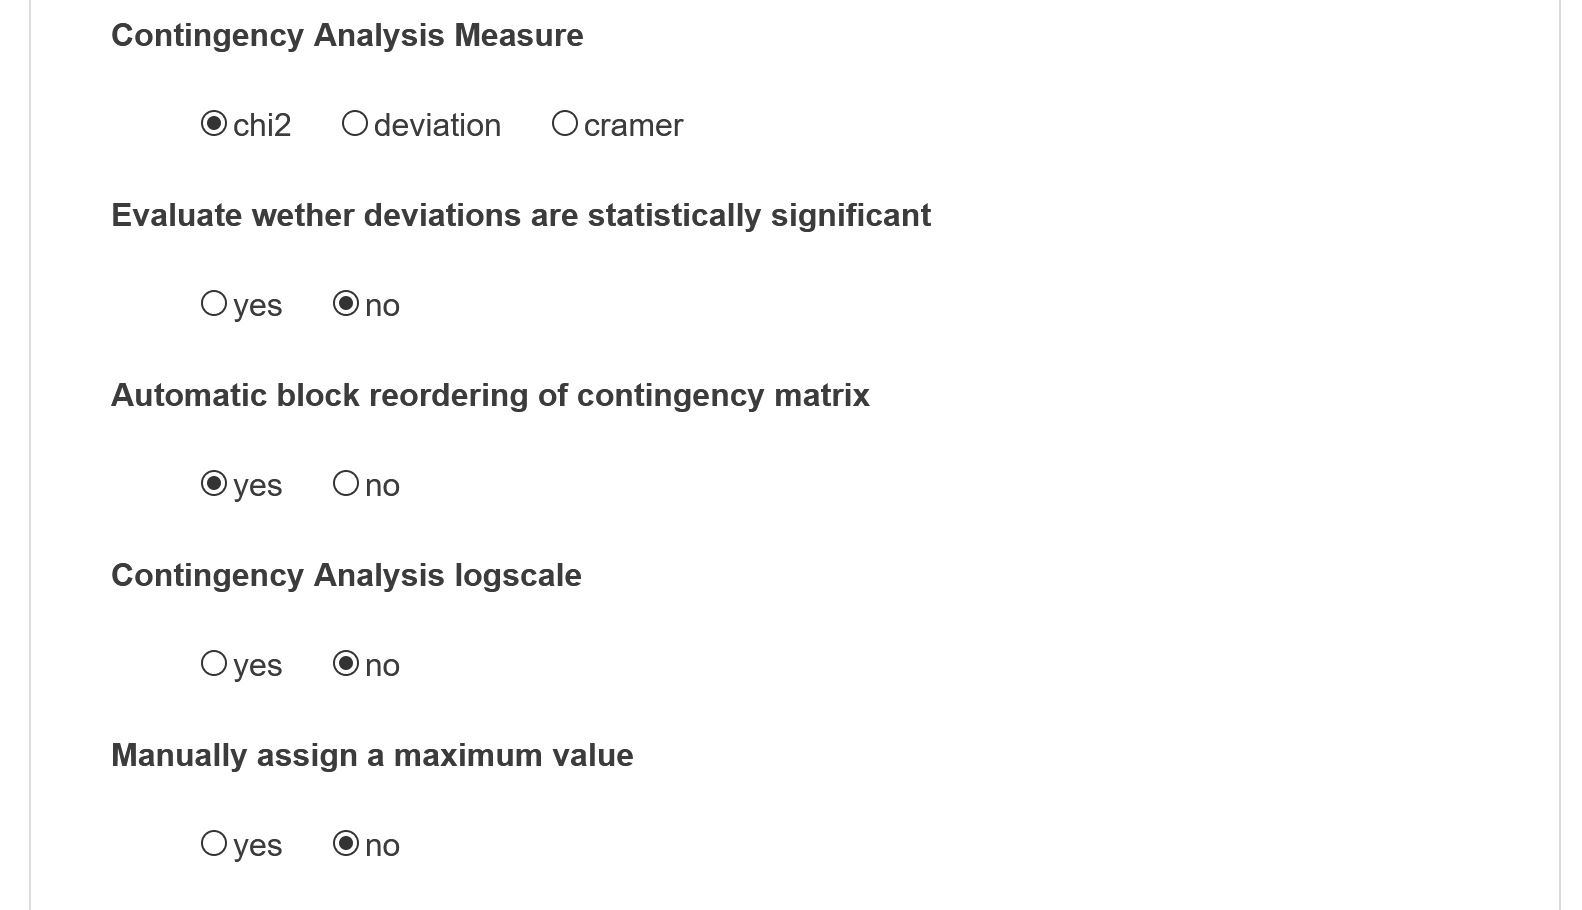
Contingency Analysis Measure
Choose the contingency analysis measure to use. Three measures are available to highlight the discrepancy between both distributions. First a matrix of expected values of co-occurrences is computed following the null hypothesis that distribution are independent. Either classic oriented Chi2 measure or deviation measure are proposed. Chi2 measure directly indexes the color of the cell to its chi2 score (that is the ratio between the square of the number of co-occurrences between A(i) and B(j) minus its expected number under null hypothesis divided by this same expected number). The deviation measure maps the increase of observed co-occurrences of A(i) and B(j) compared to the expected value. If a cell has value 6 for instance it means that the number of joint mentions is 600% higher than expected. If negative, -4 for instance, it means that the number of expected co-occurrences is 400% higher than the observed number of co-occurrences. Cramer measure is also an option.
Evaluate whether deviations are statistically significant
A Fisher exact test is performed on each cell of the matrix to assess whether the deviation is statistically significant (no cross if p-value < 0.05).
Automatic block reordering of contingency matrix
Automatic block reordering of contingency matrix (may be long when the number of nodes exceeds 10). Automatic block re-ordering simply reorders the entries in each field such that adjacent columns and rows are similarly result in a matrix which is easier to read.
Contingency Analysis logscale
One can also activate the colormap logscale option (recommended) so the smaller deviations are not faded by larger ones.
Manually assign a maximum value
By default the colormap will extend to the maximum deviation of each time step. Setting a custom limit will stabilize colormaps along time periods.
 Cortext Manager Documentation