Label editor is a simple tool made to help you to bring the visualizations produced by CorText Manager to the next level.
What to do with Label editor
With label editor tool you are able to:
- search for a specific label (useful for lexical network);
- remove some labels;
- add some text (title, cluster name…);
- move labels (in case of overlap);
- change the font (with a selection of fonts) and font size, globally for all the visualization or locally only for one label;
- save your modifications by downloading the updated svg in your computer for further improvements;
- load a svg and update it;
- download a png or svg to integrated the visualization in your own work.
Example of workflow
- Run a Terms extraction to extract relevant noun phrases of your corpus;
- Run a Network Mapping with some Time slices to draw the semantic landscape evolution of your corpus;
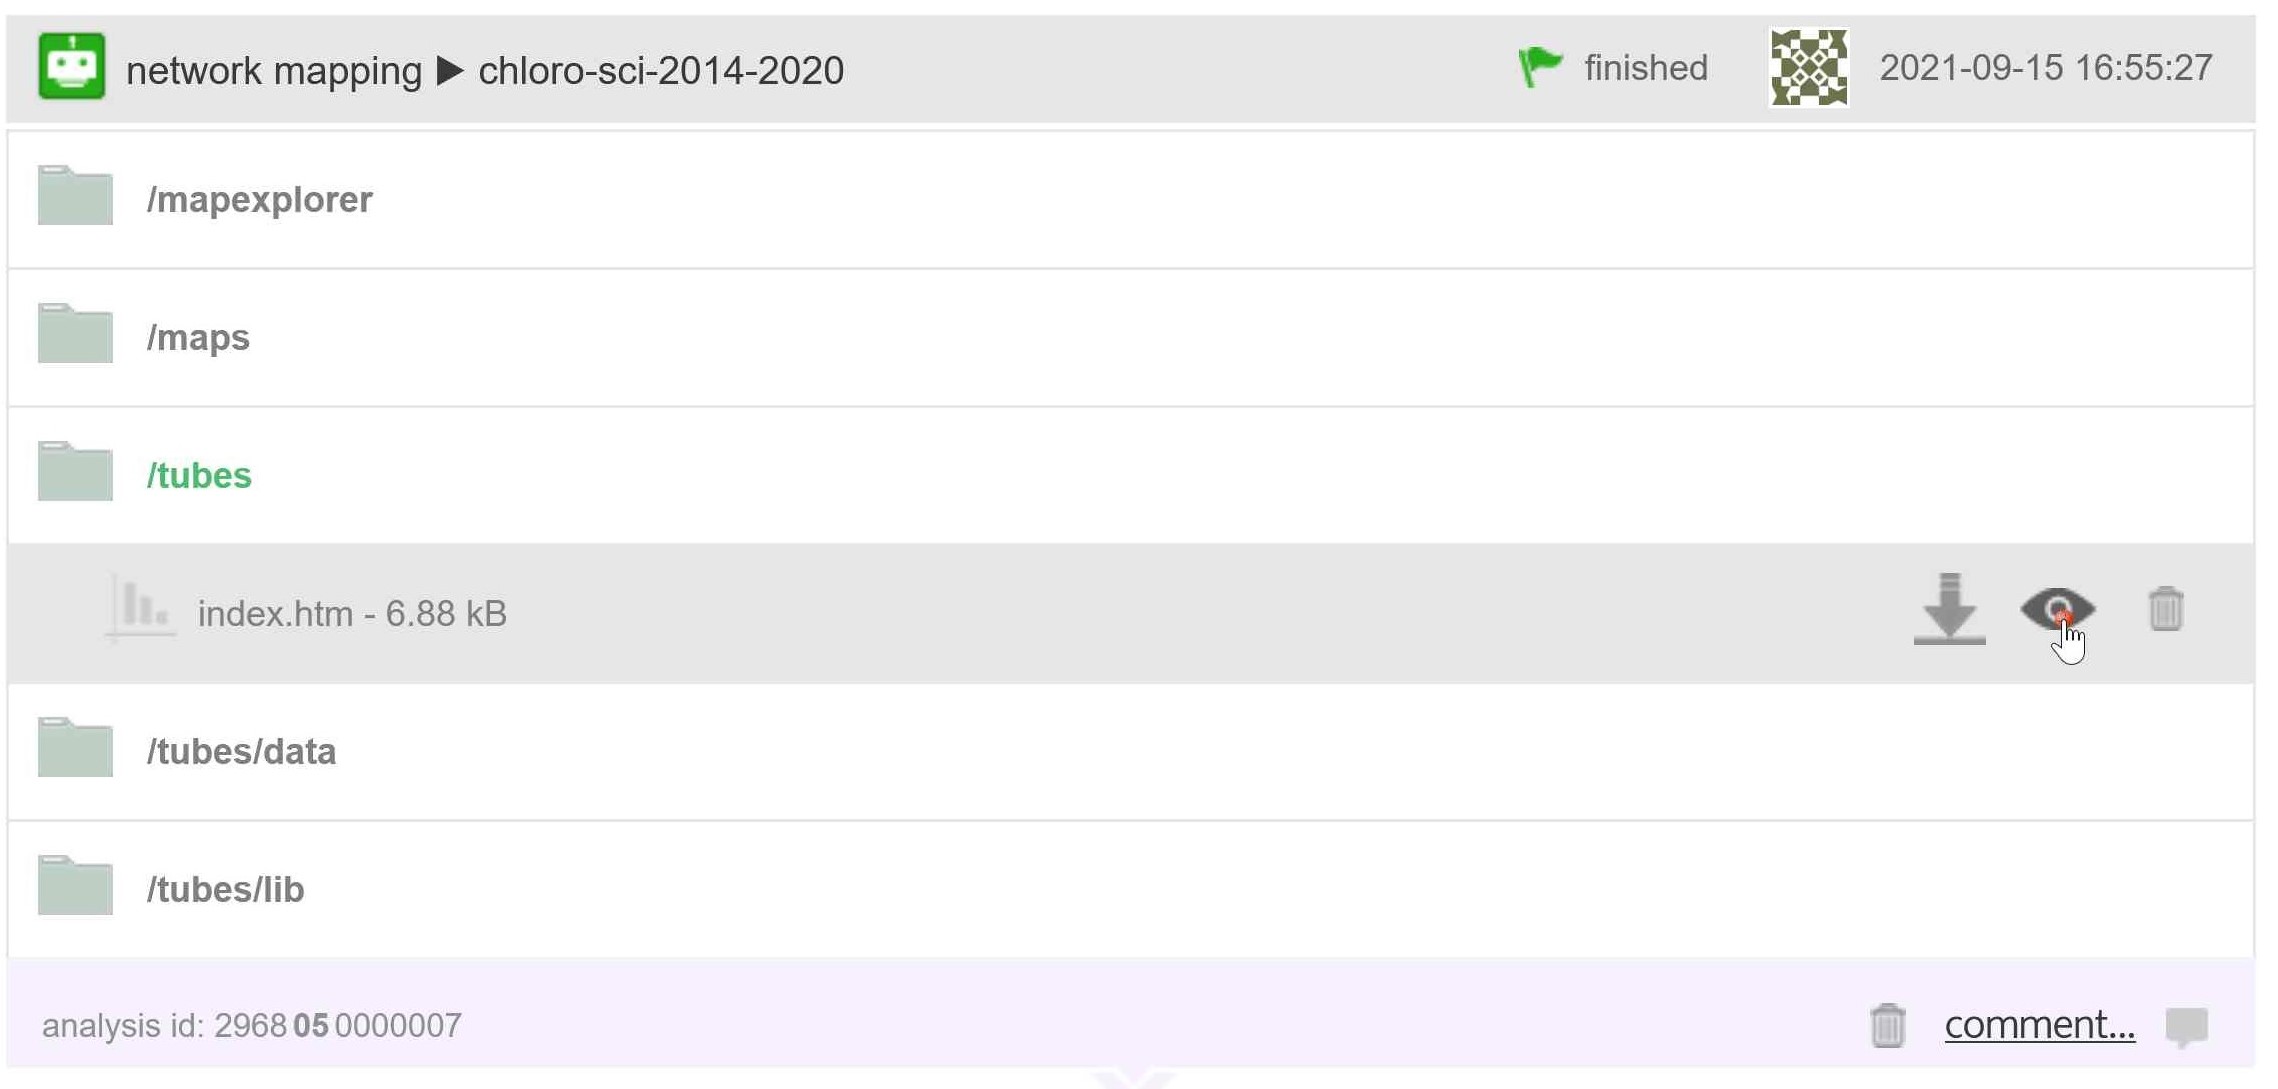
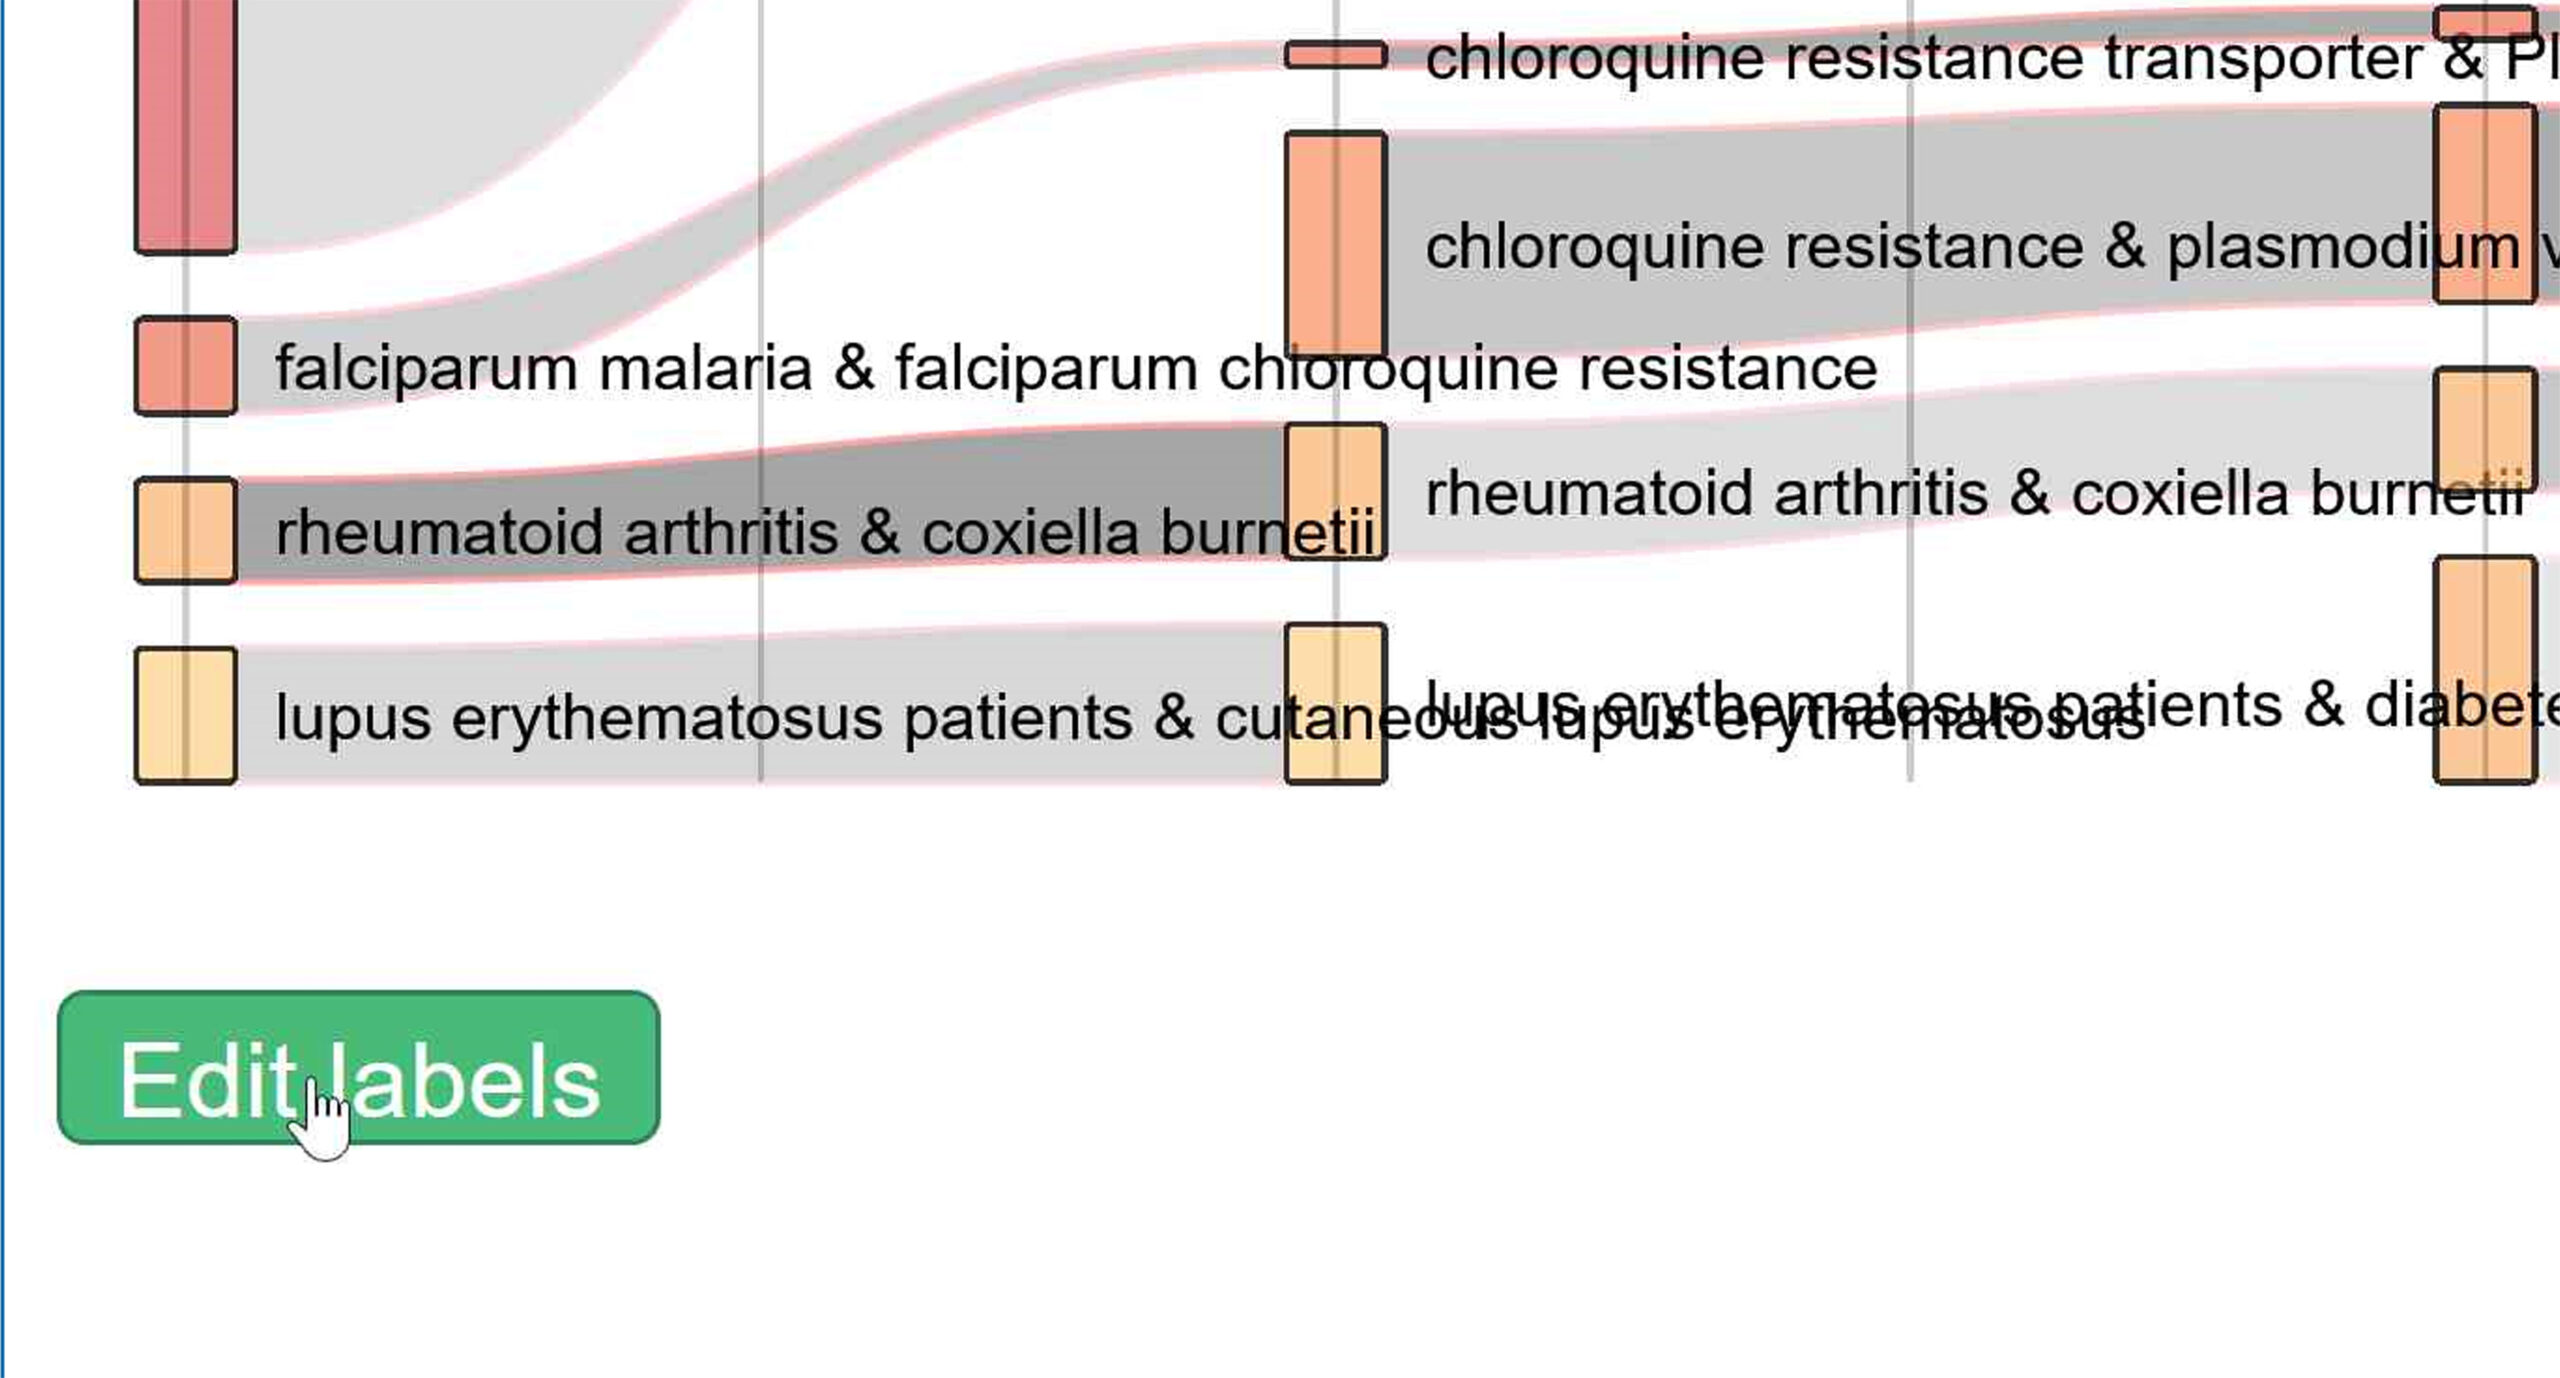
- Open the tubes layout (index.htm) to explore the results visualized as an Alluvial diagram.
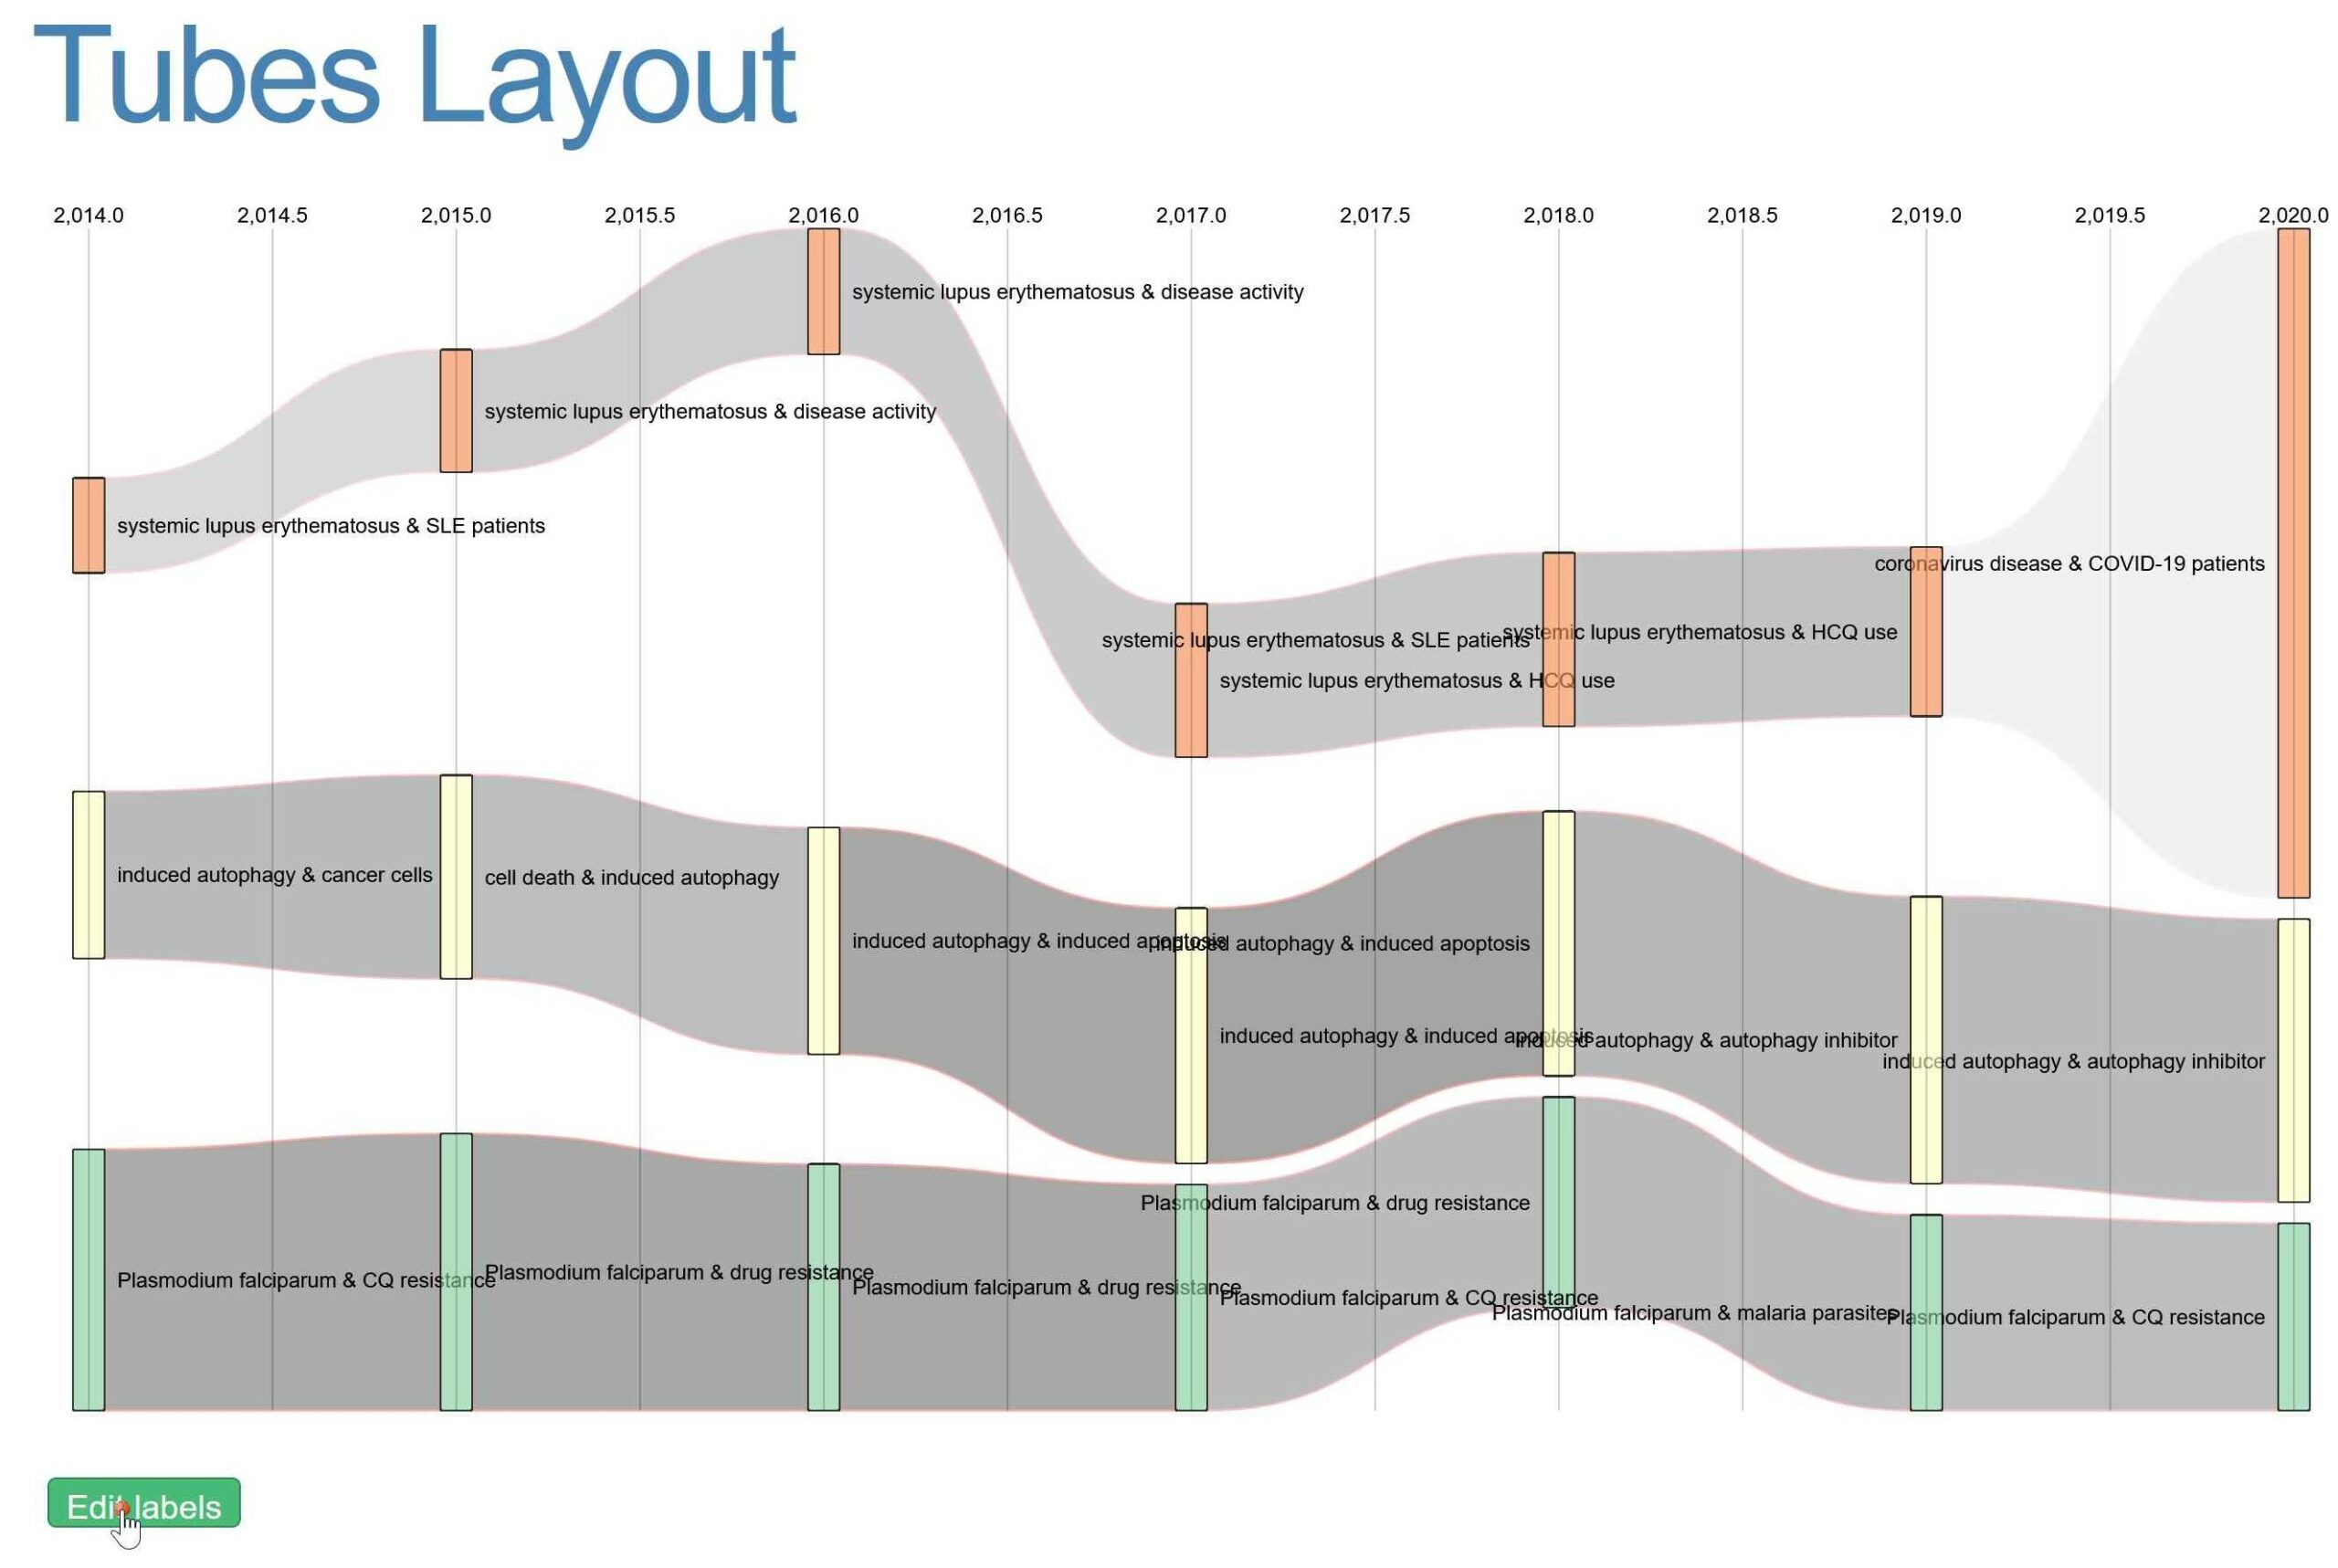
- Click on the green button “Edit labels” (see the raw visualization below)
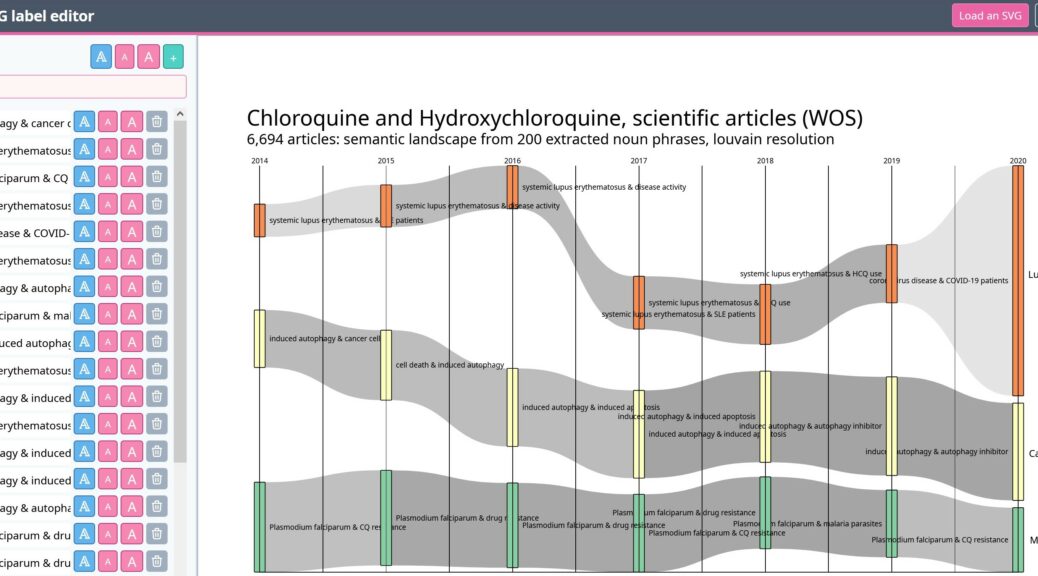
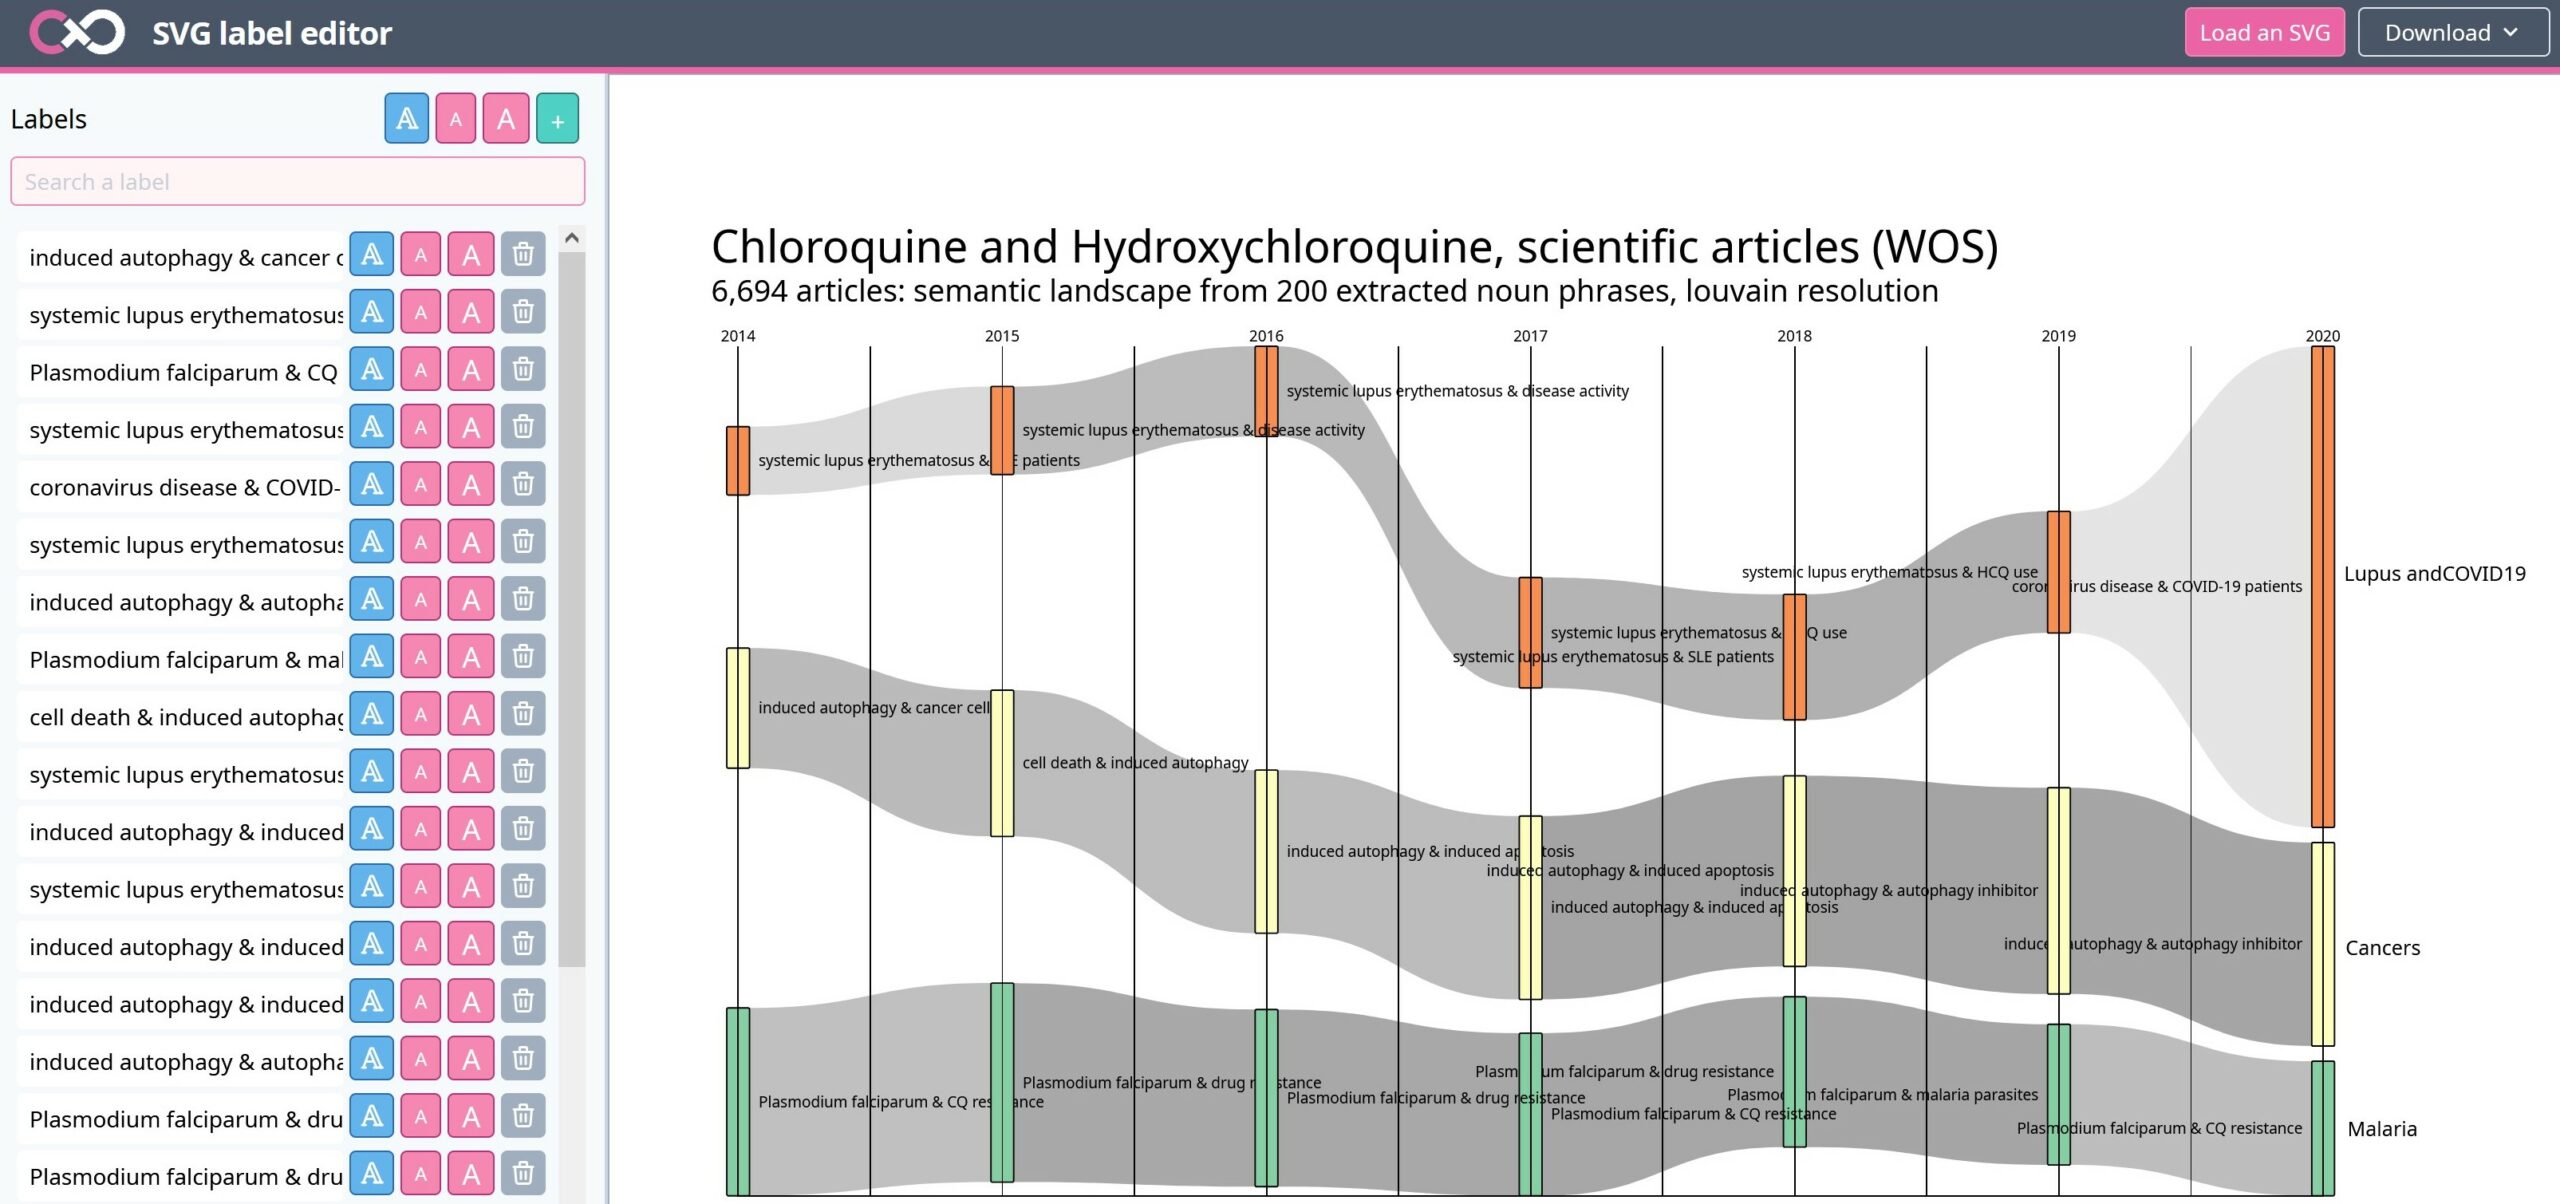
- Edit the labels according to your needs (see the updated visualization below)
- Download the svg (vectorial image: an example can be downloaded here) or the png image (an example can be downloaded here), to save it and use it outside CorText Manager
Be attentive that the edited version of the visualization will not be updated in your CorText Manager project. To save the modifications made to the visualization your need to download the svg and save it on your own computer. Later on, you are be able to upload it in the Label editor (using the pink “Load an SVG” button) to updated it again.
Types of visualization to edit
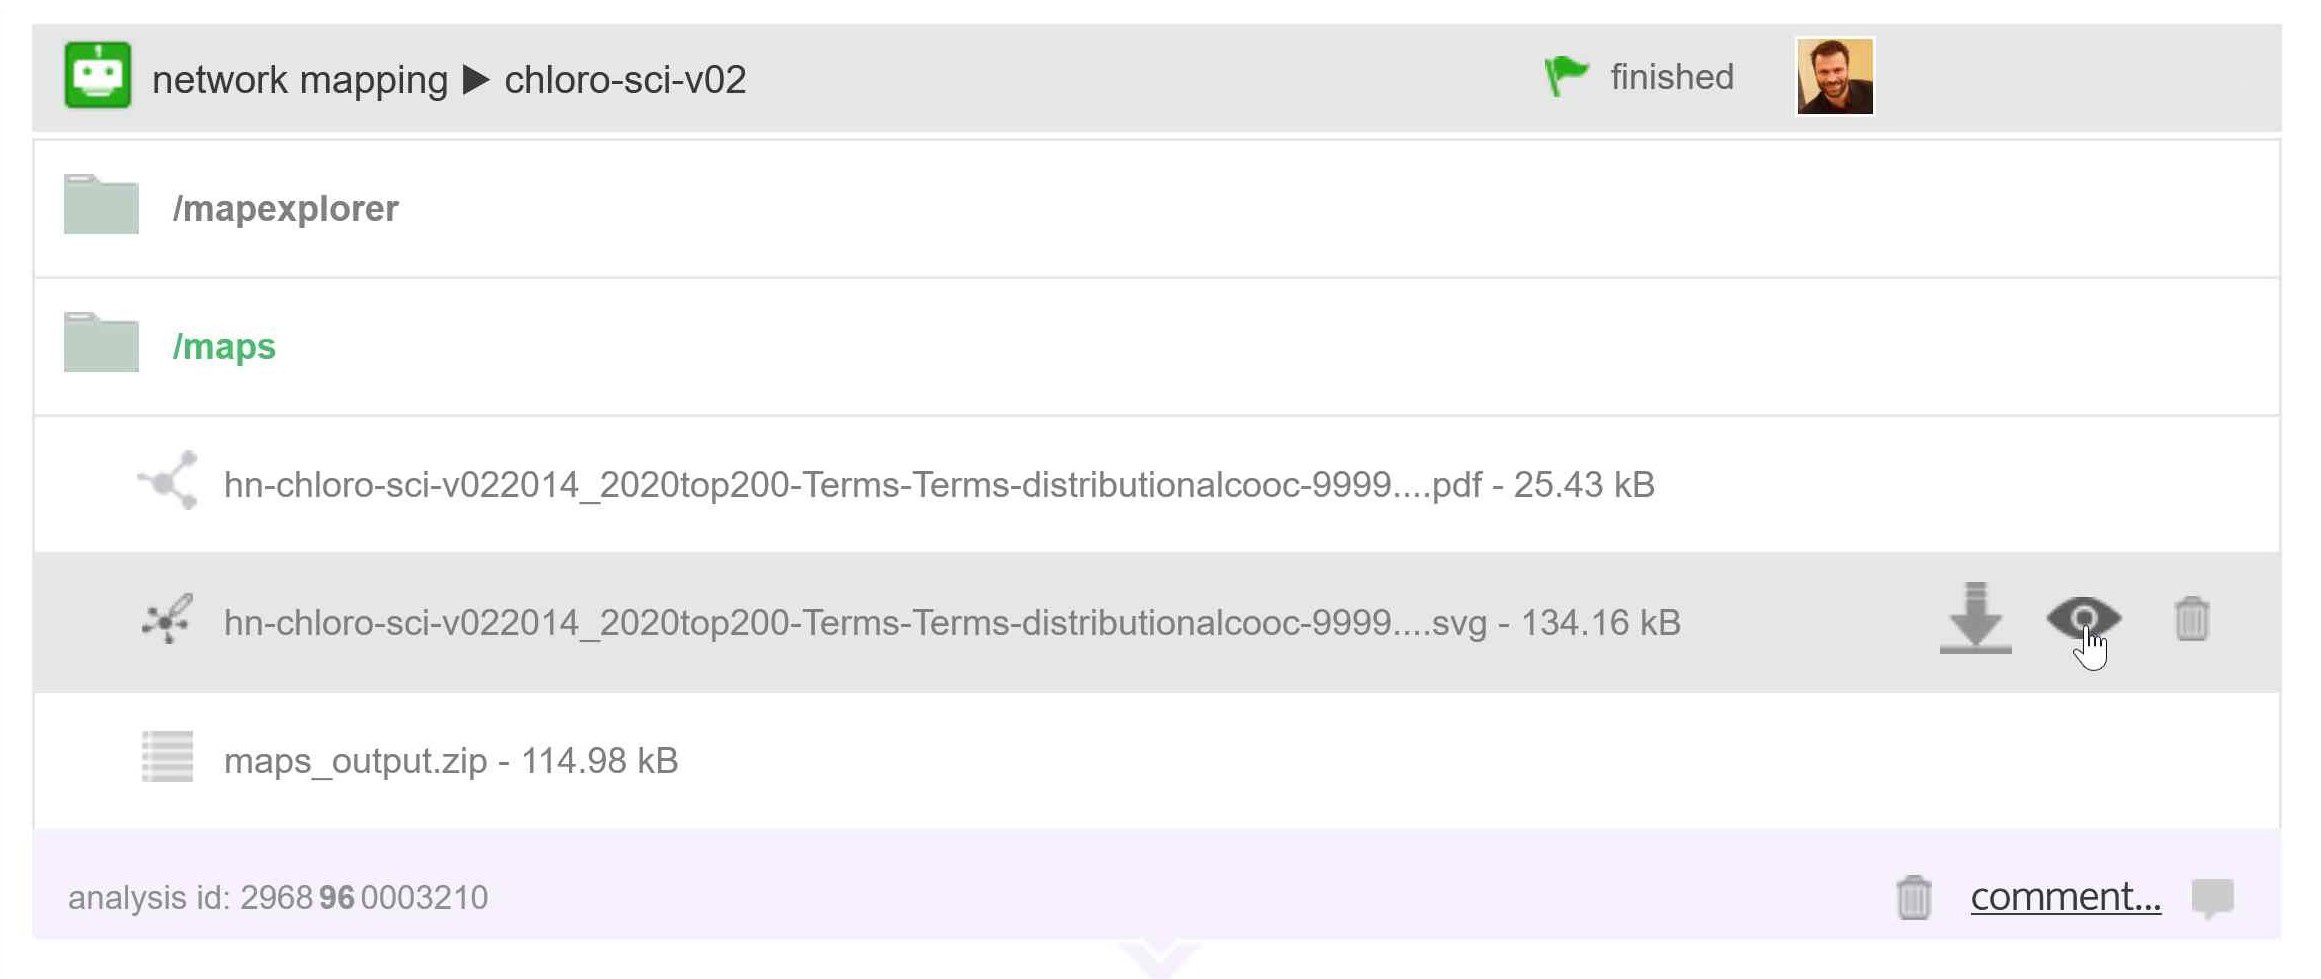
There are two ways to access to the Label editor tool depending of the script used and how is produced the visualization:
- directly in the project dashboard in the results section of the script: clicking on the Eye next to the .svg
- in the visualization using the green button “Edit labels”
Accessible through the eye icon in the dashboard of a project
- Historical network maps with axes
- Historical network maps without axes
- Co-occurrences network map
- Network map with tags from a 3nd variable
- Network map with heatmap
- Contingency matrix
Accessible through edit button in the visualization window
- Epic Epoc bumpy graph
- Sankey diagram / semantic landscape
- Demography diagram
- Contrast analysis diagram
- Distant reading, bump diagram
 Cortext Manager Documentation