Sashimi is a methodology to conduct social research supported by textual or other kind of corpora of any size.
The basic insight it incorporates is the privileged place of documents as the basis for analysis, in order to render accessible the complex assemblages of meanings expressed in a corpus, but also to link the multiple dimensions of social phenomena reflected in the data. Documents can be thought of as containers of textual contents, but also of author names, institutions, publication dates and venue, among other metadata. Documents also represent the concrete inscription produced by (human or non-human) actors. Facilitating a connection to them is necessary to trace the path — back from abstractions, visualizations and derivations — to the lived context, details and experiences that give the evidence full meaning.
For thos familiar with them, Sashimi bears some resemblance to topic models, on the one hand, and to document clustering techniques on the other. In a sense, it’s basic construct is a combination of both, organically filling a methodological gap that each in isolation faces, and usually is dealt with as an afterthought, making it hard to provide adequate data visualization and exploration interfaces.
Sashimi lets you study a corpus by simultaneously clustering documents and terms, revealing relationships between these clusters, and optionally extending them by clustering metadata of any categorical dimension. It does so in a parsimonious and nested (hierarchical) fashion, thanks to robust, state-of-the-art statistical models that avoid presenting statistically insignificant structures, and that provide clusters at different scales (see Peixoto 2017 for details). Moreover, its interactive maps and network visualizations afford seamless multi-scale and multi-sector navigation through the corpus, as rendered through the lens of the model.
There is thus no requirement to filter elements prior to conducting an analysis, opening the door to study both central and marginal issues together, and in all the detail available. One may systematically inquire the corpus from individual documents up to the entire collection, and from the individual word up to the full vocabulary, in order to uncover the subsets and levels relevant to their research question.
Here are the main concepts you need in order to enjoy Sashimi:
| Concept | Definition | Possible interpretation (STS context) |
| Domain (document block) |
A group of related documents. Documents in the same domain tend to employ the same topics | Each domain can be thought of as the outputs of an epistemic community, characterized by the shared discursive resources inscribed in the corpus. |
| Topic (term block) |
A group of related terms (words). Terms in the same topic tend to get employed in the same domains | Topics can be related to the discursive resources mobilized by, and thus connecting, and interconnecting, distinct epistemic communities |
| Metadata block (for a chosen dimension) |
A group of related metadata elements; e.g. either dates, institutions, journals or people. | They express a dimension’s insertion in the domains; for dates it corresponds to periods; for people it corresponds to profiles of participation in different epistemic communities; and so forth |
Examples
Here are some example interactive maps produced by the methods presented here:
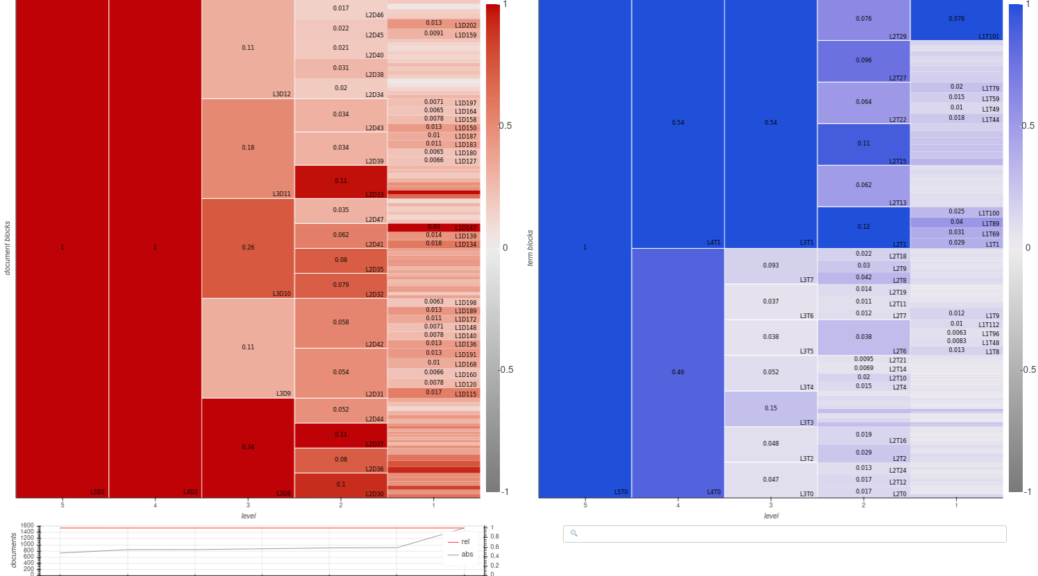
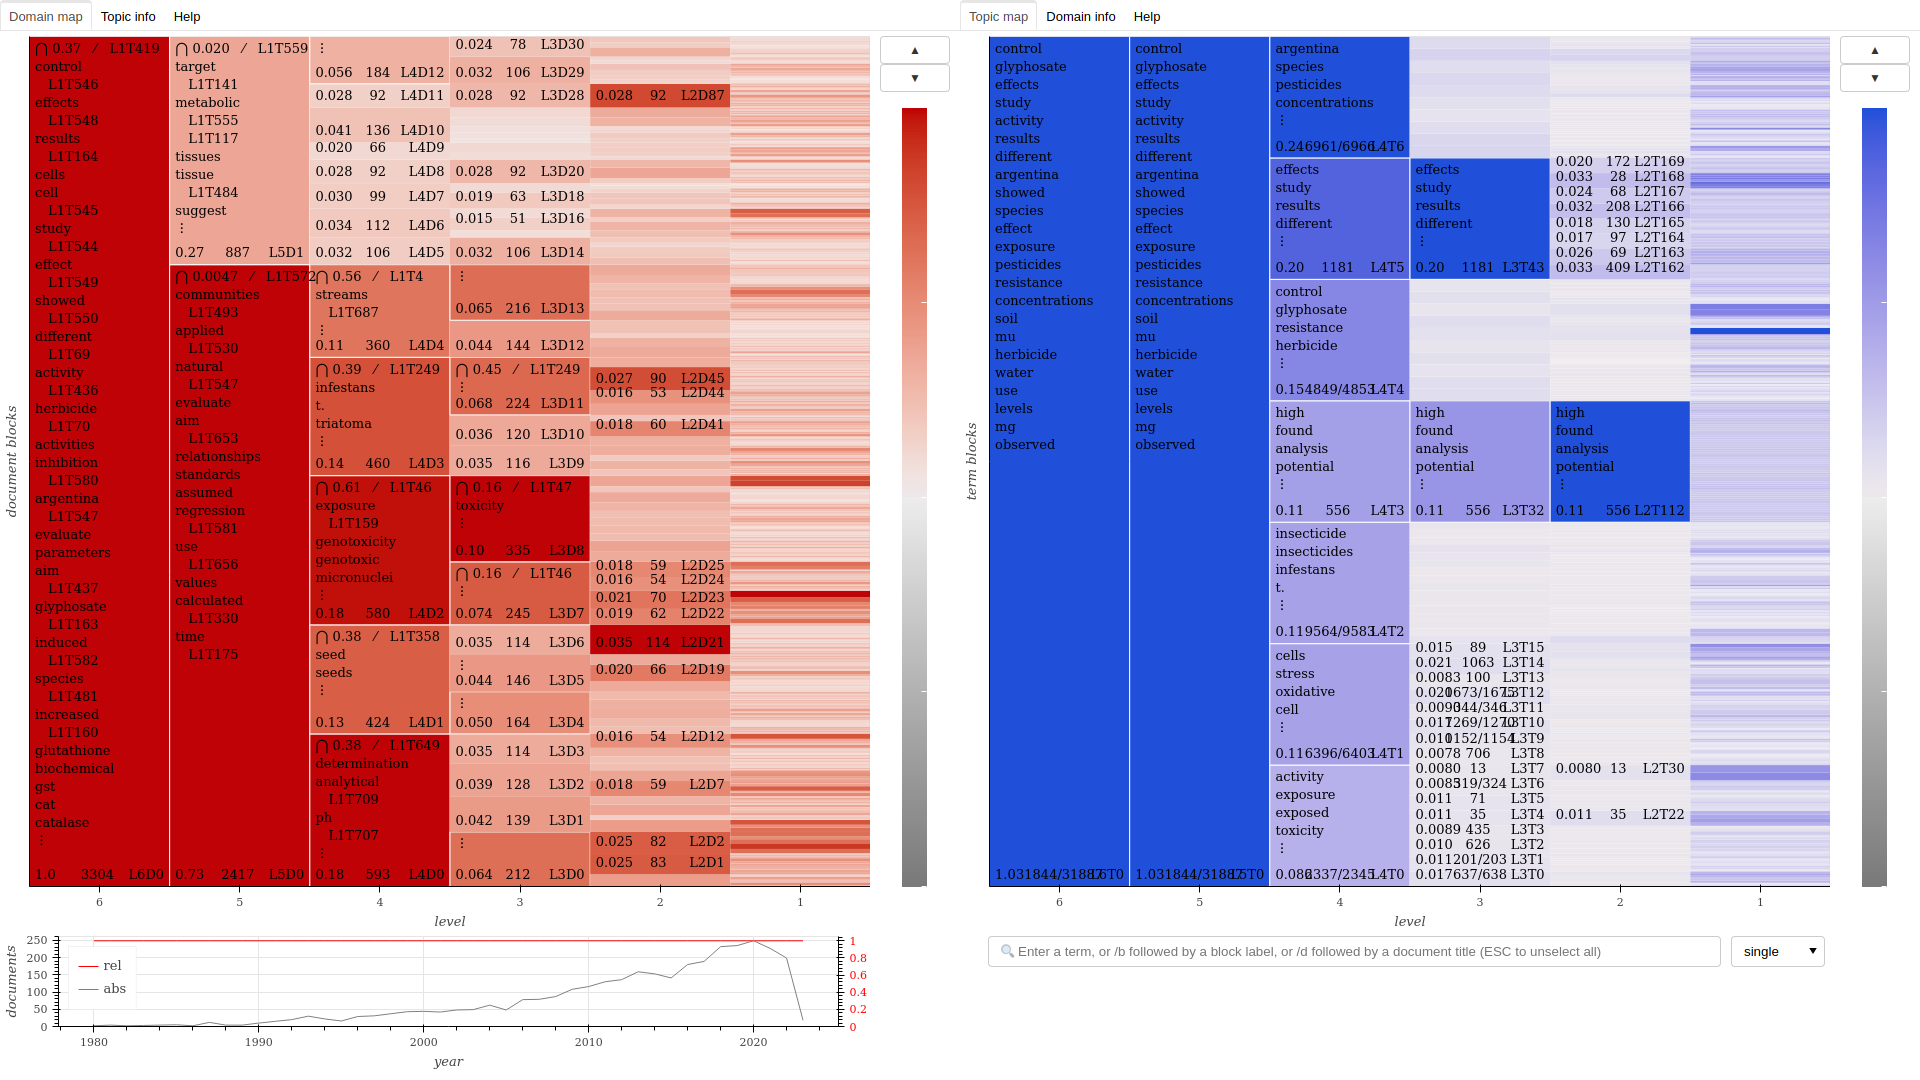
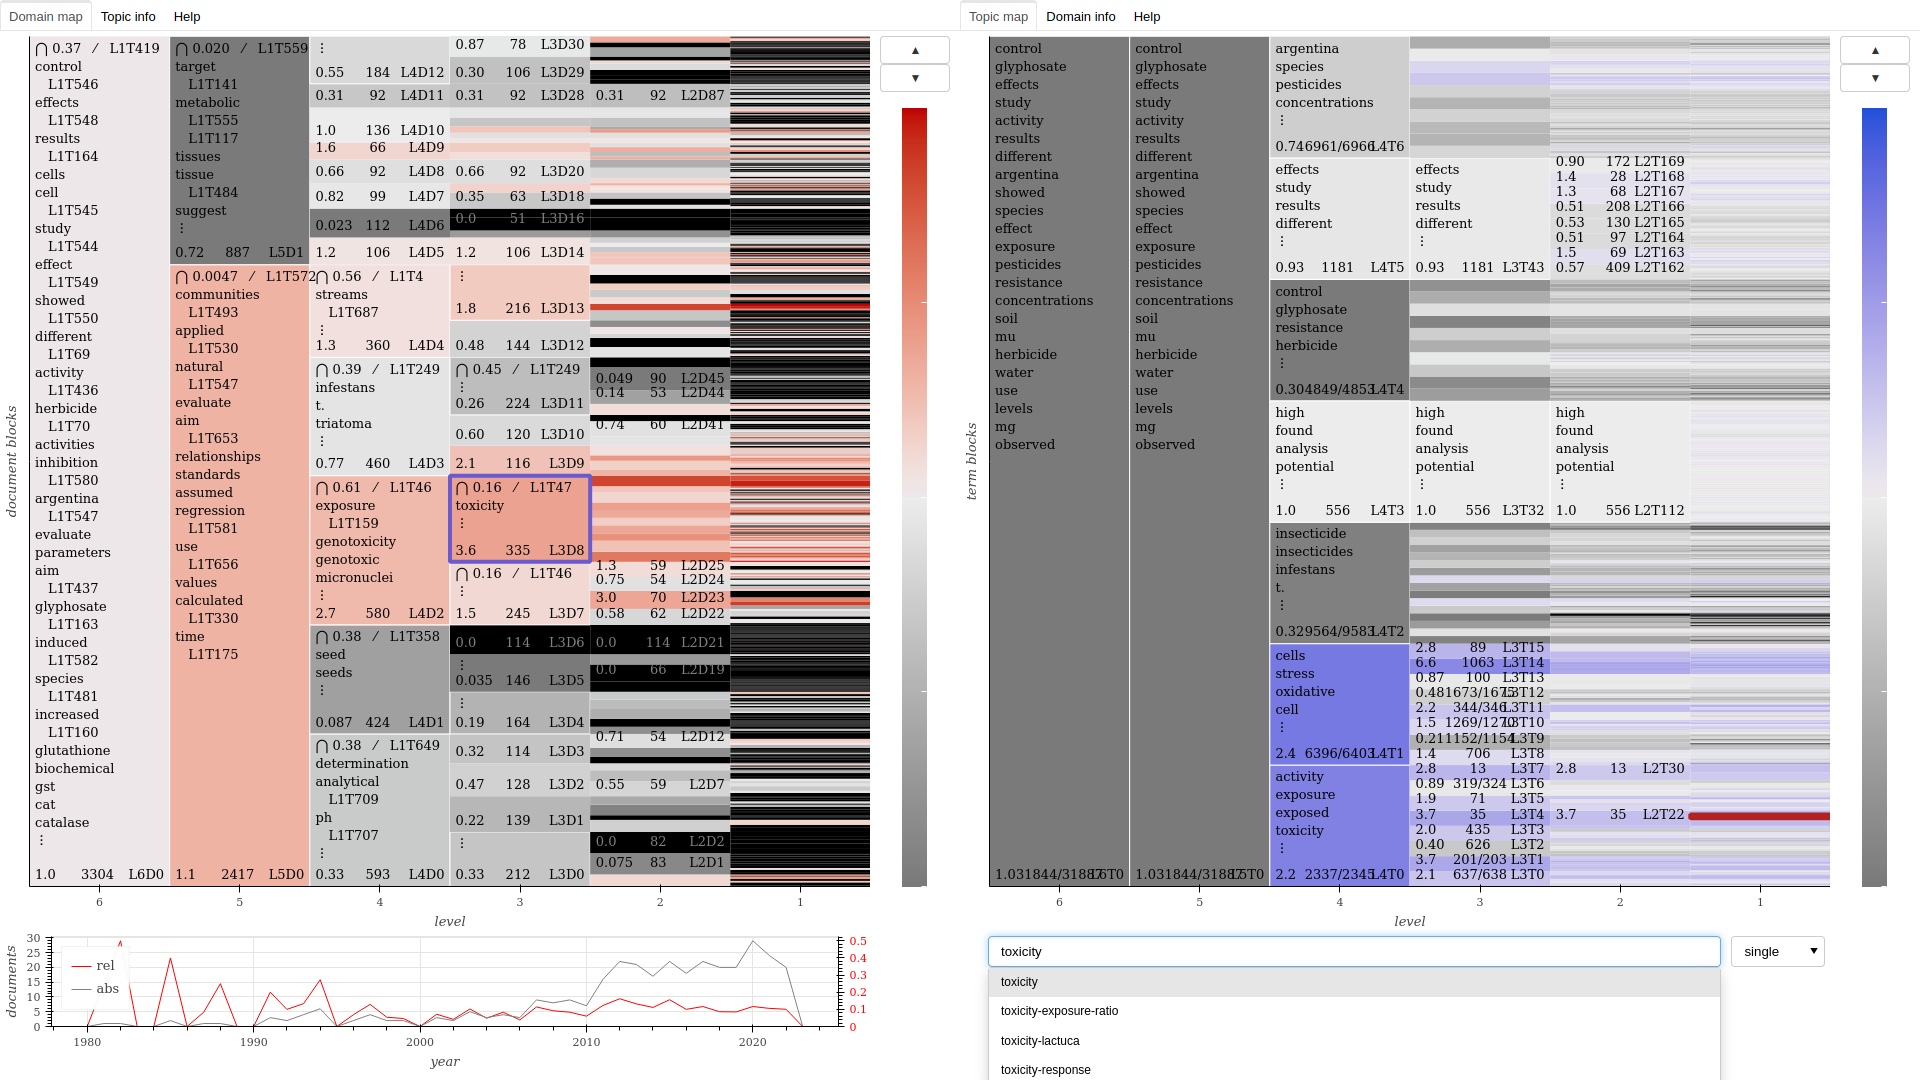
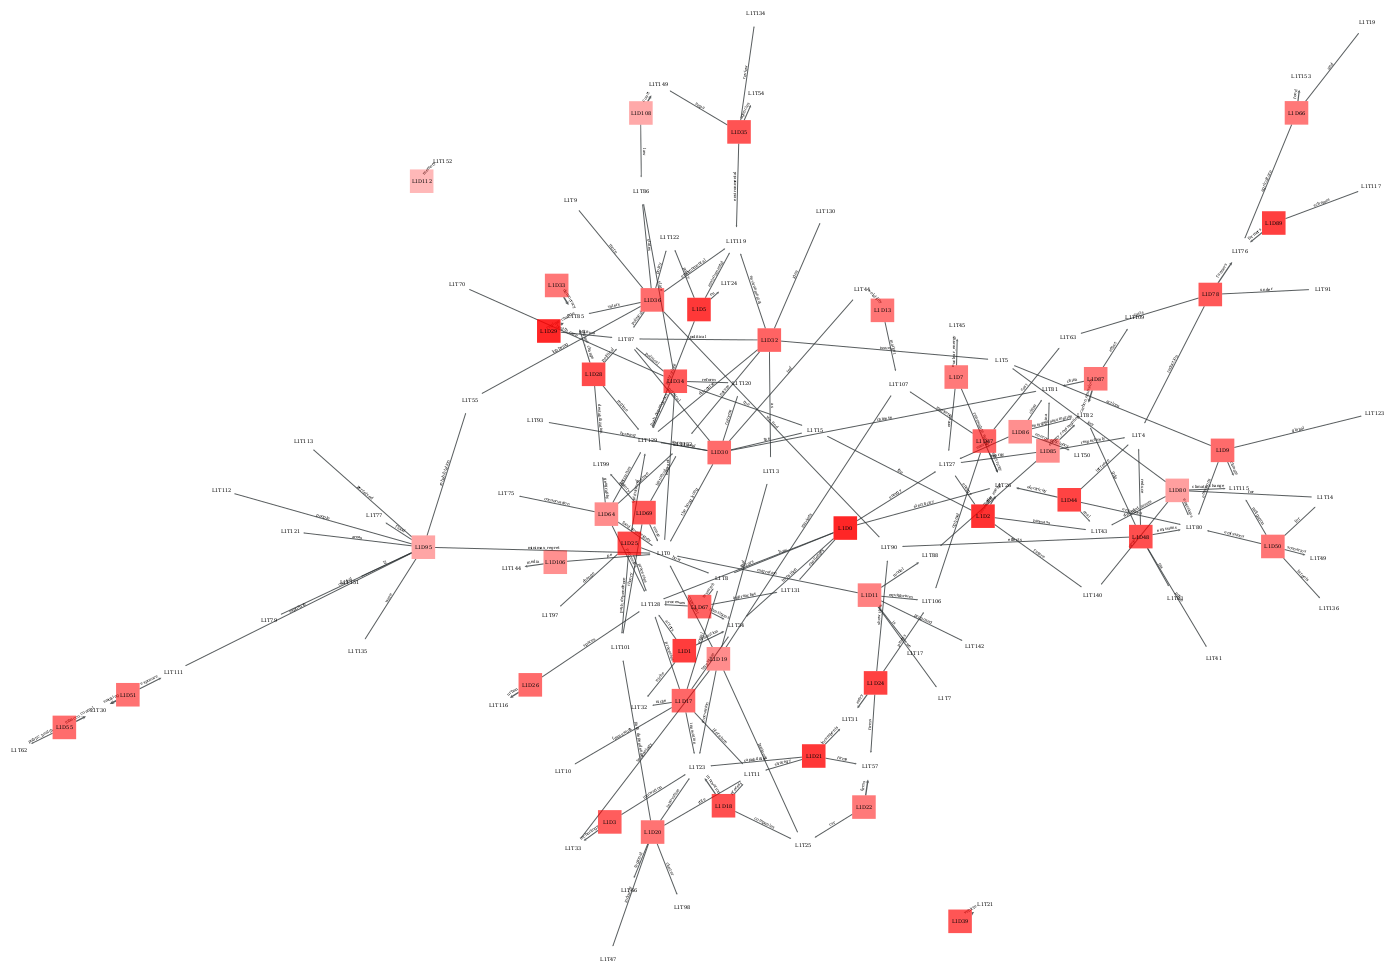
Domain-topic map for a corpus of academic publications about pesticides.
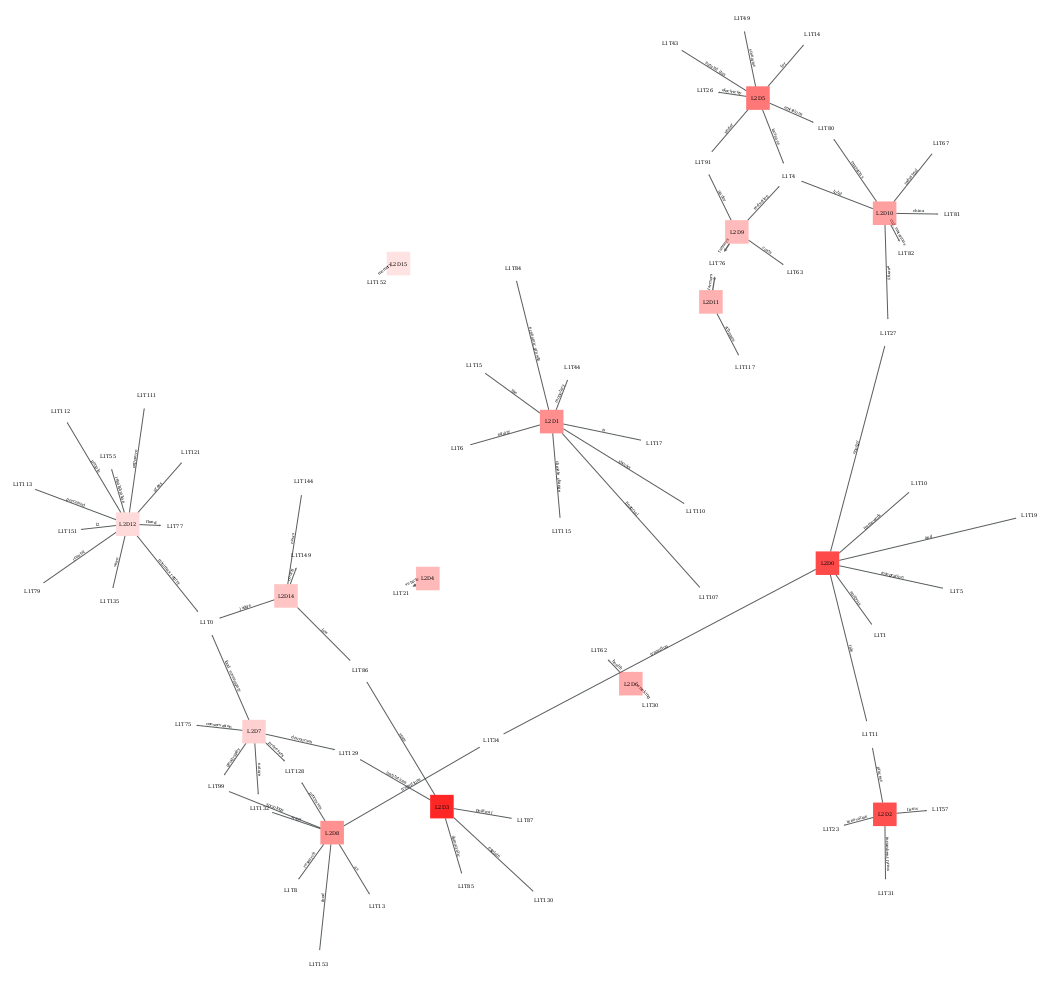
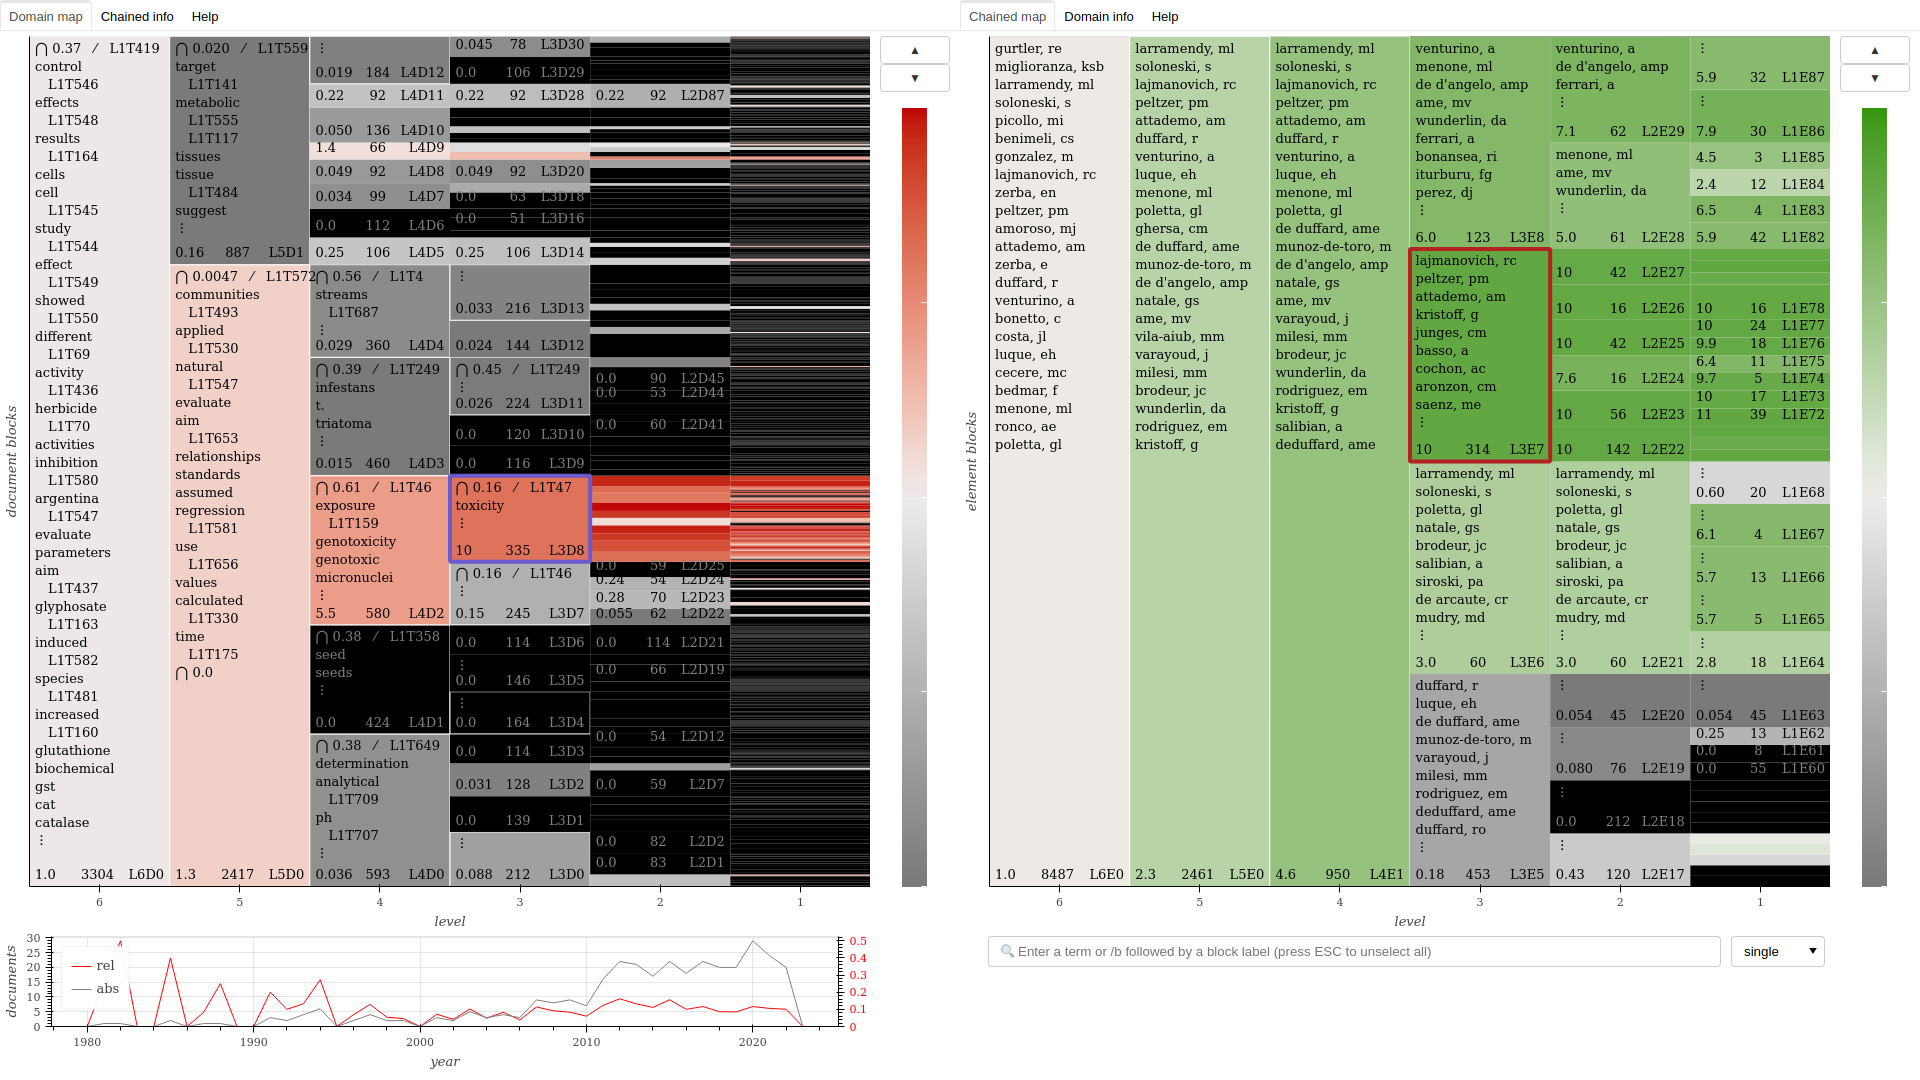
Domain-authors chained map for the same corpus, showing how author clusters relate to the domains featured in the previous map.
Note: Sashimi’s interactive maps are constantly being improved, so map’s features in these examples may be slightly different from what you get from the methods.
Usage
Sashimi follows a slightly different workflow than most scripts in Cortext Manager. Instead of a single “script”, the analysis is carried out by a group of methods that perform sequential steps.
The main sequence is to first prepare the corpus, then produce a domain-topic model, and conclude with generating the associated maps and networks.
Prepare corpus → Domain model (domain-topic) → Domain map
Later on, other dimensions can be studied through domain-chained models, based on the domain-topic model previously produced.
Domain-topic model → Domain model (domain-chained) → Domain map
1st step: Prepare Corpus
This is the obligatory first step. It will take your corpus database (as produced by Data Parser) and generate a “tokenization” of the textual data. Alternatively, you can use fields that are already tokens, such as categories, keywords, or the output of some other method from Cortext Manager.
Parameters
Text or Token source
Pick the fields you want to treat as the document’s terms. This is usually the one that contains your document’s text, but could also be titles, keywords, or lists of terms indexed by other methods. Select the field as a “text source” if it contains text that is not yet split into terms, such as abstracts, full text, messages and post contents. Select it as a “token source” if already corresponds to lists of individual terms, such as keywords, categories or indexed terms.
Build n-grams when tokenizing
When tokenizing a textual source, this indicates whether to seek composite terms that appear often in the corpus, up to a certain length. For example, if you want “São Paulo” to be treated as a single term, you’d have to choose at least a value of 2, whereas if you want the same for “Rio de Janeiro”, you’d have to pick 3. A text such as “Hagbard moved from Rio de Janeiro to São Paulo”, if the names of both cities appear often in your corpus, might then get tokenized as [“Hagbard”, “moved”, “from”, “Rio_de_Janeiro”, “to”, “São_Paulo”].
Transformation to apply to document’s tokenized text source
Choose “none” to account for multiple uses of a term in the same document. Choose “discard frequency” to only consider whether a term is used or not. This choice depends on your data, but choosing the latter may be useful to attenuate the influence of stylistic variations.
2nd step: Domain-topic Model
This is the second and crucial stage of Sashimi. It will fit the underlying generative model, finding clusters that correspond well to the data: documents get clustered in domains, and terms get clustered in topics. The method is Domain Model with the option domain-topic.
Fitting a model
Because fitting a complex statistical model is a computationally difficult task, this stage may take a long time to complete. For a corpus of a few thousand documents it may take up to an hour, but at a size of hundreds of thousands of documents it may take over a day, so be patient.
Moreover, since the results are stochastic in nature, it might be worth running the method twice, or more, if you’re not satisfied with them. Yet, as we’ll discuss, we provide a clear criteria for preferring one run over another. Running again may be the case, for example, if the structure of your data is subtle and a first run finds no clusters. Still, a single run should yield a good clustering in most cases.
Because Sashimi relies on well grounded statistics, the quality of different clusterings is quantitatively comparable. With each run, the method will output a file whose name states “entropy: 999.999“, where the numbers in the there tell you the value of the model entropy with the inferred clusters. The comparison between runs is very simple: in general, the model fit with the lowest entropy should be preferred. Also, that file’s contents show the numbers of clusters at each level of the hierarchy.
Parameters
Prepared corpus
The prepared corpus to be modeled. Choices are a list of analysis IDs corresponding to previous executions of the Prepare Corpus method on the chosen corpus. You’ll find this ID at the bottom of the box for each analysis in a project.
3rd step: Domain-topic Maps
The method is Domain Maps with the option domain-topic.
This step produces three kinds of objects: interactive maps, used to navigate the clusters found in the model, domain networks, that provide a relational view at different scales, and domain tables, useful for systematic study and coding, which can be done with the help of a spreadsheet. Detailed instructions for interacting with the maps are found within it, by clicking on the “Help” tab.
The maps and tables are self-contained HTML files that can be stored and used off-line. The networks are provided in PDF and GRAPHML formats, the latter of which can be imported in free-and-open-source network visualization software such as Gephi.
Parameters
Domain-topic model
The domain-topic model to be mapped. Choices are a list of IDs of executions of the Domain Model method, with the option domain-topic, on the chosen corpus.
Title column
Which field to display as the title of documents on the map.
Time column
Which field to attempt to treat as a temporal dimension in order to display the evolution of document clusters. May also work with non-temporal dimensions, giving a histogram.
URI column
If your corpus contains URIs for documents, a link can be shown with their titles, providing easy access to the original. Many datasets have an URL or URI field, or some other field that can be modified to produce an URL for it.
URL template
If there is no explicit URL field in the data, you may build URLs using values from the field set as URL column, by providing a template where {} will get replaced by the values. Here are some common examples:
- If you have a DOI field, you can get an URL with the following template:
https://doi.org/{} - For a Pubmed ID (PMID), use
https://pubmed.ncbi.nlm.nih.gov/{} - And for a HAL Id, use
https://hal.archives-ouvertes.fr/{}
These are only a few examples, you can similarly build URLs for data from other academic and bibliographic databases, social media sites, newspapers etc.
You’re good to go!
If you got here, you’re ready to use the fundamental steps of Sashimi! We suggest you take a break to go ahead and try them.
When you come back, two further steps will allow you to extend the document-term clusters to metadata dimensions.
4th step: Chain dimension
Once you have inferred domains for your corpus’ documents, and if they contain metadata such as time, institutions, authors or geospatial data, you may be asking yourself: how do these other variables get distributed between domains? Do some institutions or years tend to get associated with similar domains, while others with different ones?
That question can be answered by chaining these dimensions in a new model, called a Domain-chained Model. In this new model, metadata values get clustered according to their association to domains.
The method is Domain Model with the option domain-chained. Since this method will fit a new model, what has been said of model fitting for the Domain-topic model, in the Fitting a model section, applies as well.
Parameters
Domain-topic model
The domain-topic model for which to model metadata clusters. Choices are a list of IDs of executions of the Domain Model method, with option domain-topic, on the chosen corpus.
Chained dimension
The dimension of the metadata you want to cluster: dates, years, journals, authors, keywords, categories etc.
5th step: Domain-chained Map
After chaining a metadata dimension to your domains, you will very likely want to navigate the inferred relationships between document and metadata clusters. You can produce a map for that, to be used in conjunction with the respective domain-topic map. The method is Domain Maps with the option domain-chained.
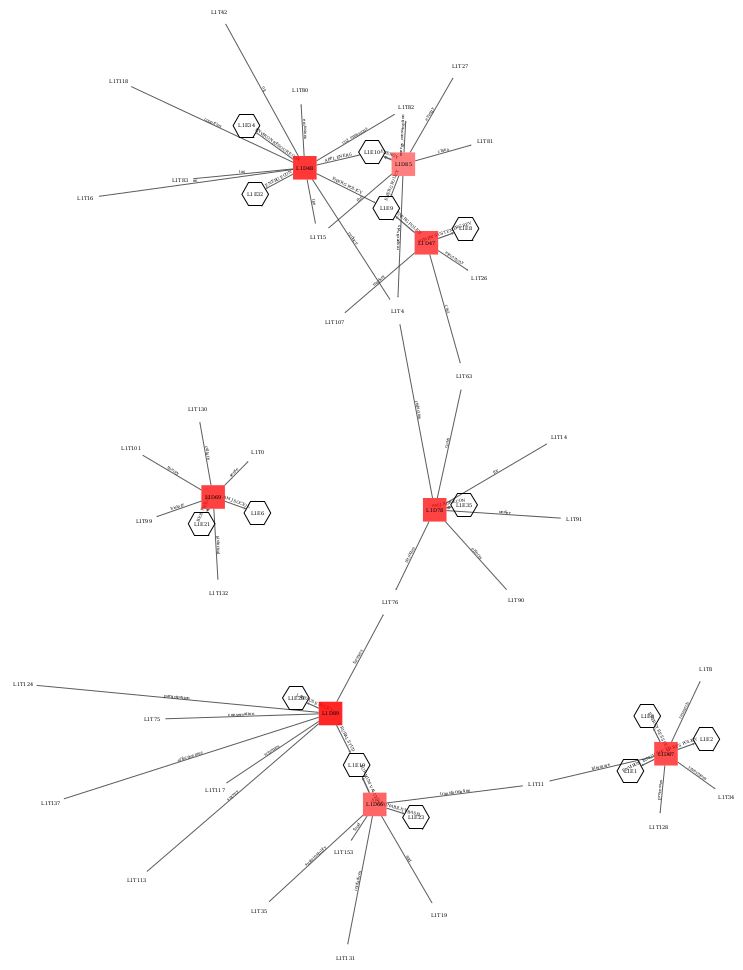
A network view of domains and topics enriched with clusters of journals, evidencing the disciplinary relations of and between domains.
Parameters
As described in the Domain-topic map step, except the choices of model are a list of IDs of executions of the Domain Model method with option domain-chained.
Chopsticks
Inside each map you will find a “Help” tab explaining how to use it. Check it out! And don’t hesitate to contact the Cortext team if you have any questions.
Code
The code of sashimi is a Logiciel Libre (Free and Open Source Software). You can find the main Python library here, and the details of its implementation within Cortext Manager here.
Bibliography and citation
If you’re curious about the details or want a more thorough discussion on how to interpret the maps, you’re welcome to read the paper introducing the methodology. It’s also the reference to be cited if you publish using this method:
Alexandre Hannud Abdo, Jean-Philippe Cointet, Pascale Bourret, Alberto Cambrosio (2021). Domain-topic models with chained dimensions: Charting an emergent domain of a major oncology conference. Journal of the Association for Information Science and Technology. doi:10.1002/asi.24606
 Cortext Manager Documentation