Cortext manager has deployed within its application the free open source tool « Retina » – created by OuestWare and Tommaso Venturini from CNRS CIS. It will help you explore your network maps, improve their visualization, download or share online high-quality network map images and offers archiving capacity of your network maps – directly from the Cortext manager application.
Retina offers various options (see “Retina’s features” paragraph below) enabling you to apply filters to the data to be displayed on the network map, to choose the colors and size of nodes and the number of labels to be displayed, and finally to export the network map either as an url to be integrated into your work/publications/communications or as an HTML extract to be embedded inside a web page.
Connection between Retina and Cortext manager and archiving capacities are managed by the Cortext platform.
How to access to Retina?
Retina’s capabilities via the Cortext platform can be mobilized in different ways.
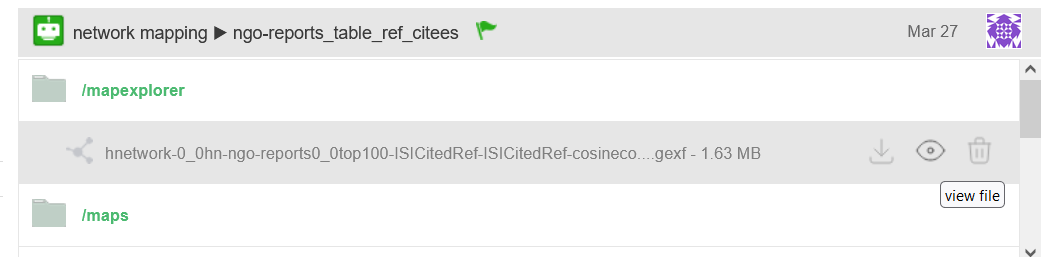
- After launching the script “Network mapping” in your dashboard project in Cortext Manager. After running the “Network mapping” script, click on the “/mapexplorer” folder in the entry created into your project dashboard. This will give you access to the “.gexf” file created by Cortext manager, summarizing various network metrics. Retina uses this file to recreate the network visualization. Click on the “View file” (eye icon) to access to your network graph open in Retina tool.
- You can import a “.gexf” file (produced by Cortext manager or any other tool that can export a “.gexf” file such as “Gephi”) directly into a Cortext Manager dashboard project (use the classic “Upload file” icon to download the file in your dashboard project)
- You can upload a “.gexf” file directly to the following link https://retina.cortext.net/. Note that using this path will let you view and manipulate your network, but will not allow you to archive your map using the Cortext platform server.
Retina’s features
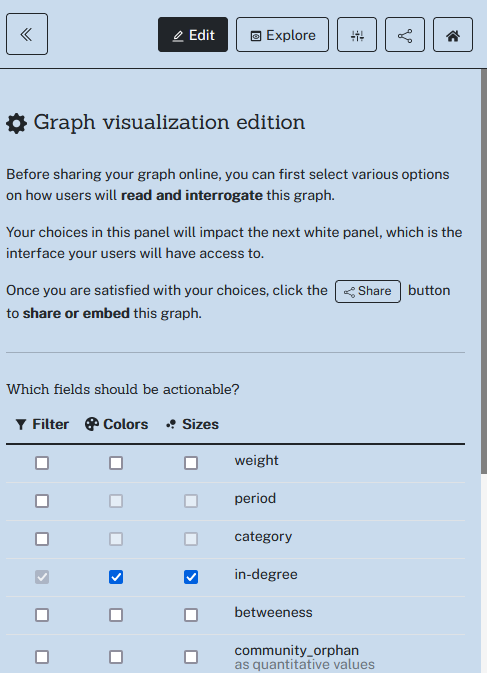
Edit icon
By clicking on this icon, you will be able to select the metrics to be used in the “Explore” tab. By checking the boxes of the metrics available on the screen that interest you, you will be able then, in the “Explore” tab, to filter the data to be displayed on the network, and to adapt the color and size of the nodes according to the metrics selected. A summary of selected metrics is also available in the “Explore” tab.
Note that certain parameters (e.g. fields r, g, b, a) in the “.gexf” file produced by Cortext manager is information only necessary for Cortext manager’s operation and is therefore not relevant as network metrics in Retina.
Note also that the Retina “What are the edge directions – All edges should be treated as directed” feature is only relevant if you have modified the ” Edges filtering advanced settings” parameter (selected at “yes”) and then defined a “Number of top neighbours to consider” when launching the Cortext Manager’s Network mapping script. With this parameter activated, Cortext manager evaluates which node is linked to its neighbor: for example, a node may be in its neighbor’s top N, while its neighbor is not (see Network mapping – edges definition part). The direction of the arrow on the links in Retina’s map will thus provide information on the presence, absence or twofold presence of the link in the top N of neighboring nodes.
Exploration icon
In this tab, you will be able to filter nodes (by modifying the scale available below the graph summarizing the selected measurement), adapt their size (select the metric you want in the drop-down menu “Size nodes by…”) and color (select the metric you want in the drop-down menu “Color nodes by…”). The metrics available in the drop-down menus are those you previously selected in the “Edit” window.
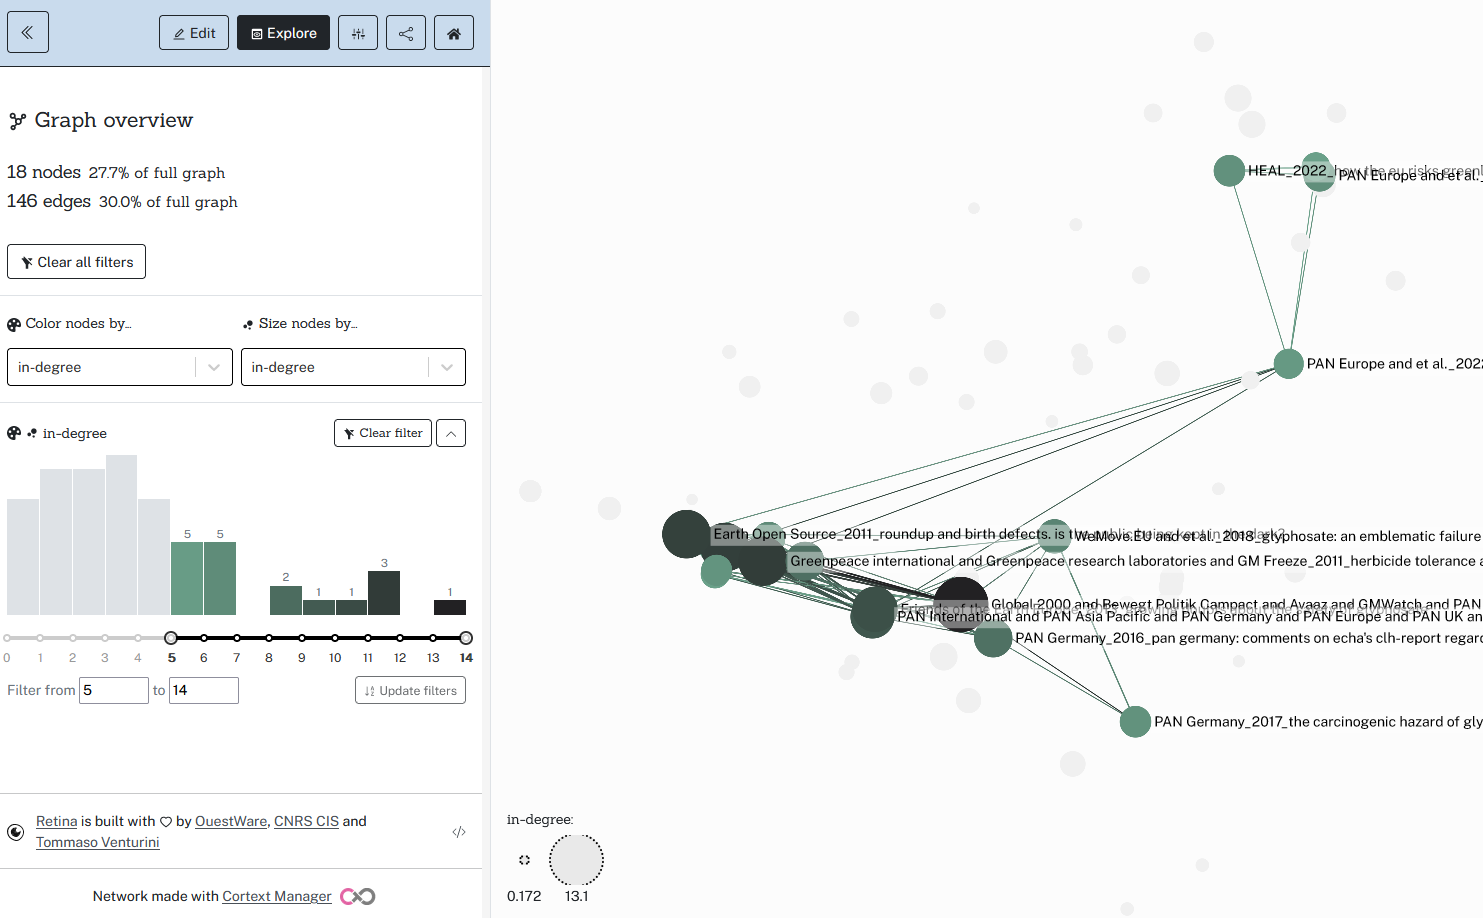
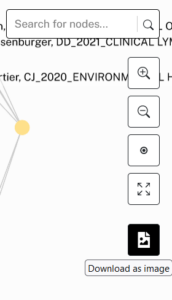
On this tab, you can also obtain all the metrics for a specific node, either by clicking on the node of interest on the graph, or by typing the node of interest in the toolbar “Search for nodes” at the top right of the screen.
Edit readabilty settings icon
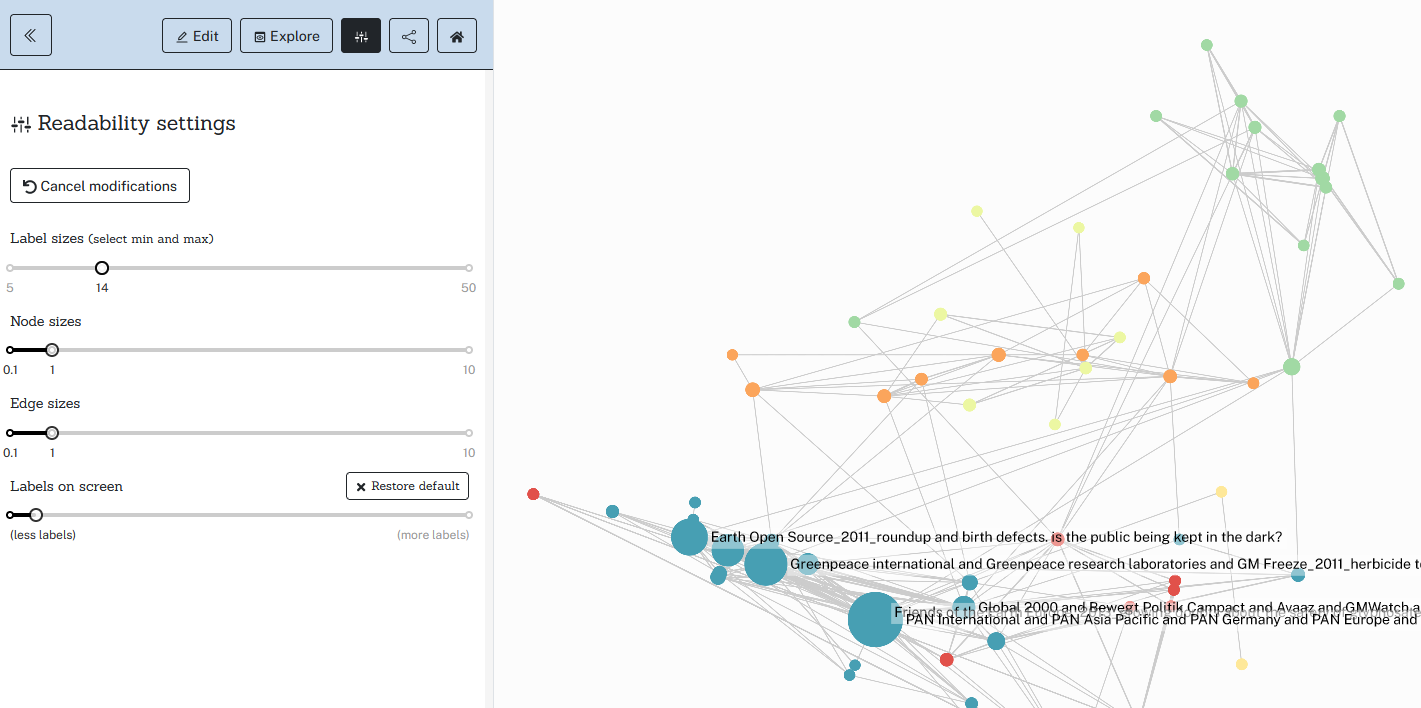
By clicking on this icon, you will be able to change size of labels, nodes and links of the network. You can also define the number of labels you wish to keep on the network map.
Get an image, share or archive the network map
When you have set all the settings and you are satisfied with the visualization obtained of your network map, you can click on the “Share” button at the top left of the screen.
This will open the option window available for sharing your network map:
- Graphs in Retina can be shared as classic links (“by sharing a simple URL” option) or special links to be embedded in iframes (“by embedding it inside a webpage” option).
- An option (“I want users to be able to filter and change colors and sizes”) will allow users with whom you share your network map to modify or filter it. If you disable this option, users won’t be able to modify the visualization and they will see exactly the same visualization that you have configured.
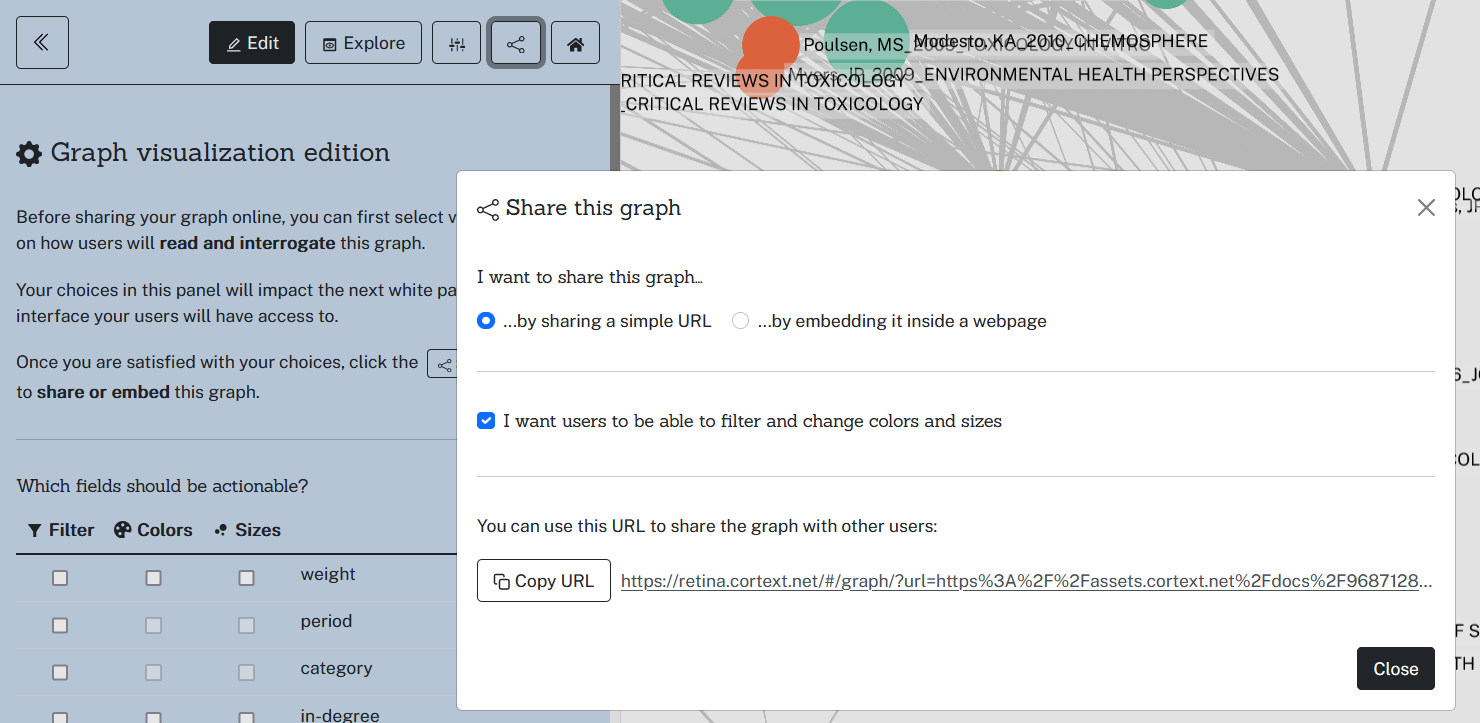
Finally, an icon “Download as image” in the top right corner of the screen will also allow you to download your network map’s image in a “.png” format.
Reference
Retina is built by OuestWare, CNRS CIS and Tommaso Venturini. https://gitlab.com/ouestware/retina
 Cortext Manager Documentation