Epic Epoch is a simple script for tracking dramatic changes in the composition of a field over time.
How Epic Epoch works
It acts in three steps:
- First, the N most frequently occurring entities are selected at each time period,
- A frequency timeline is built for each of the selected terms
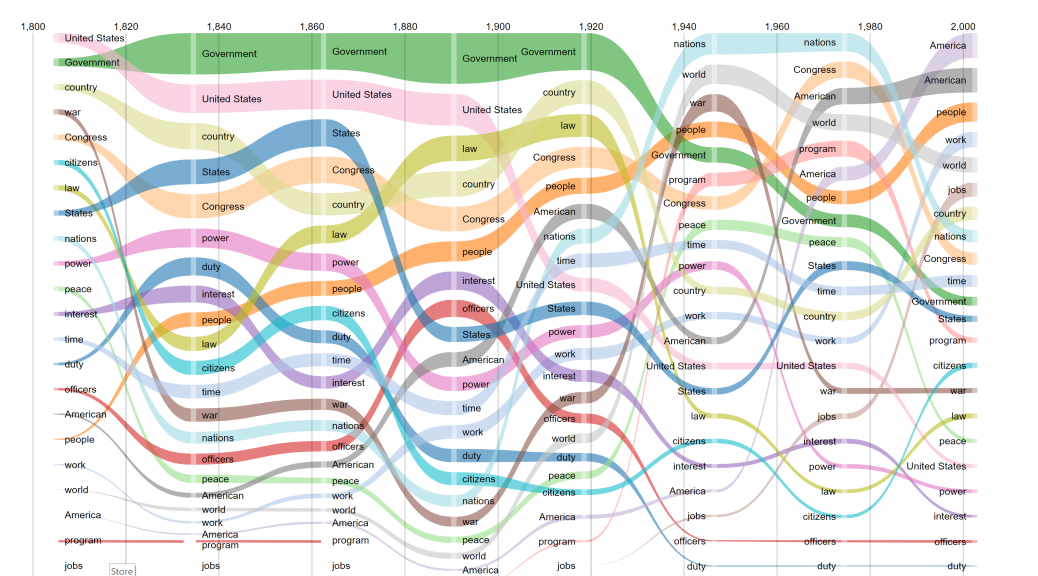
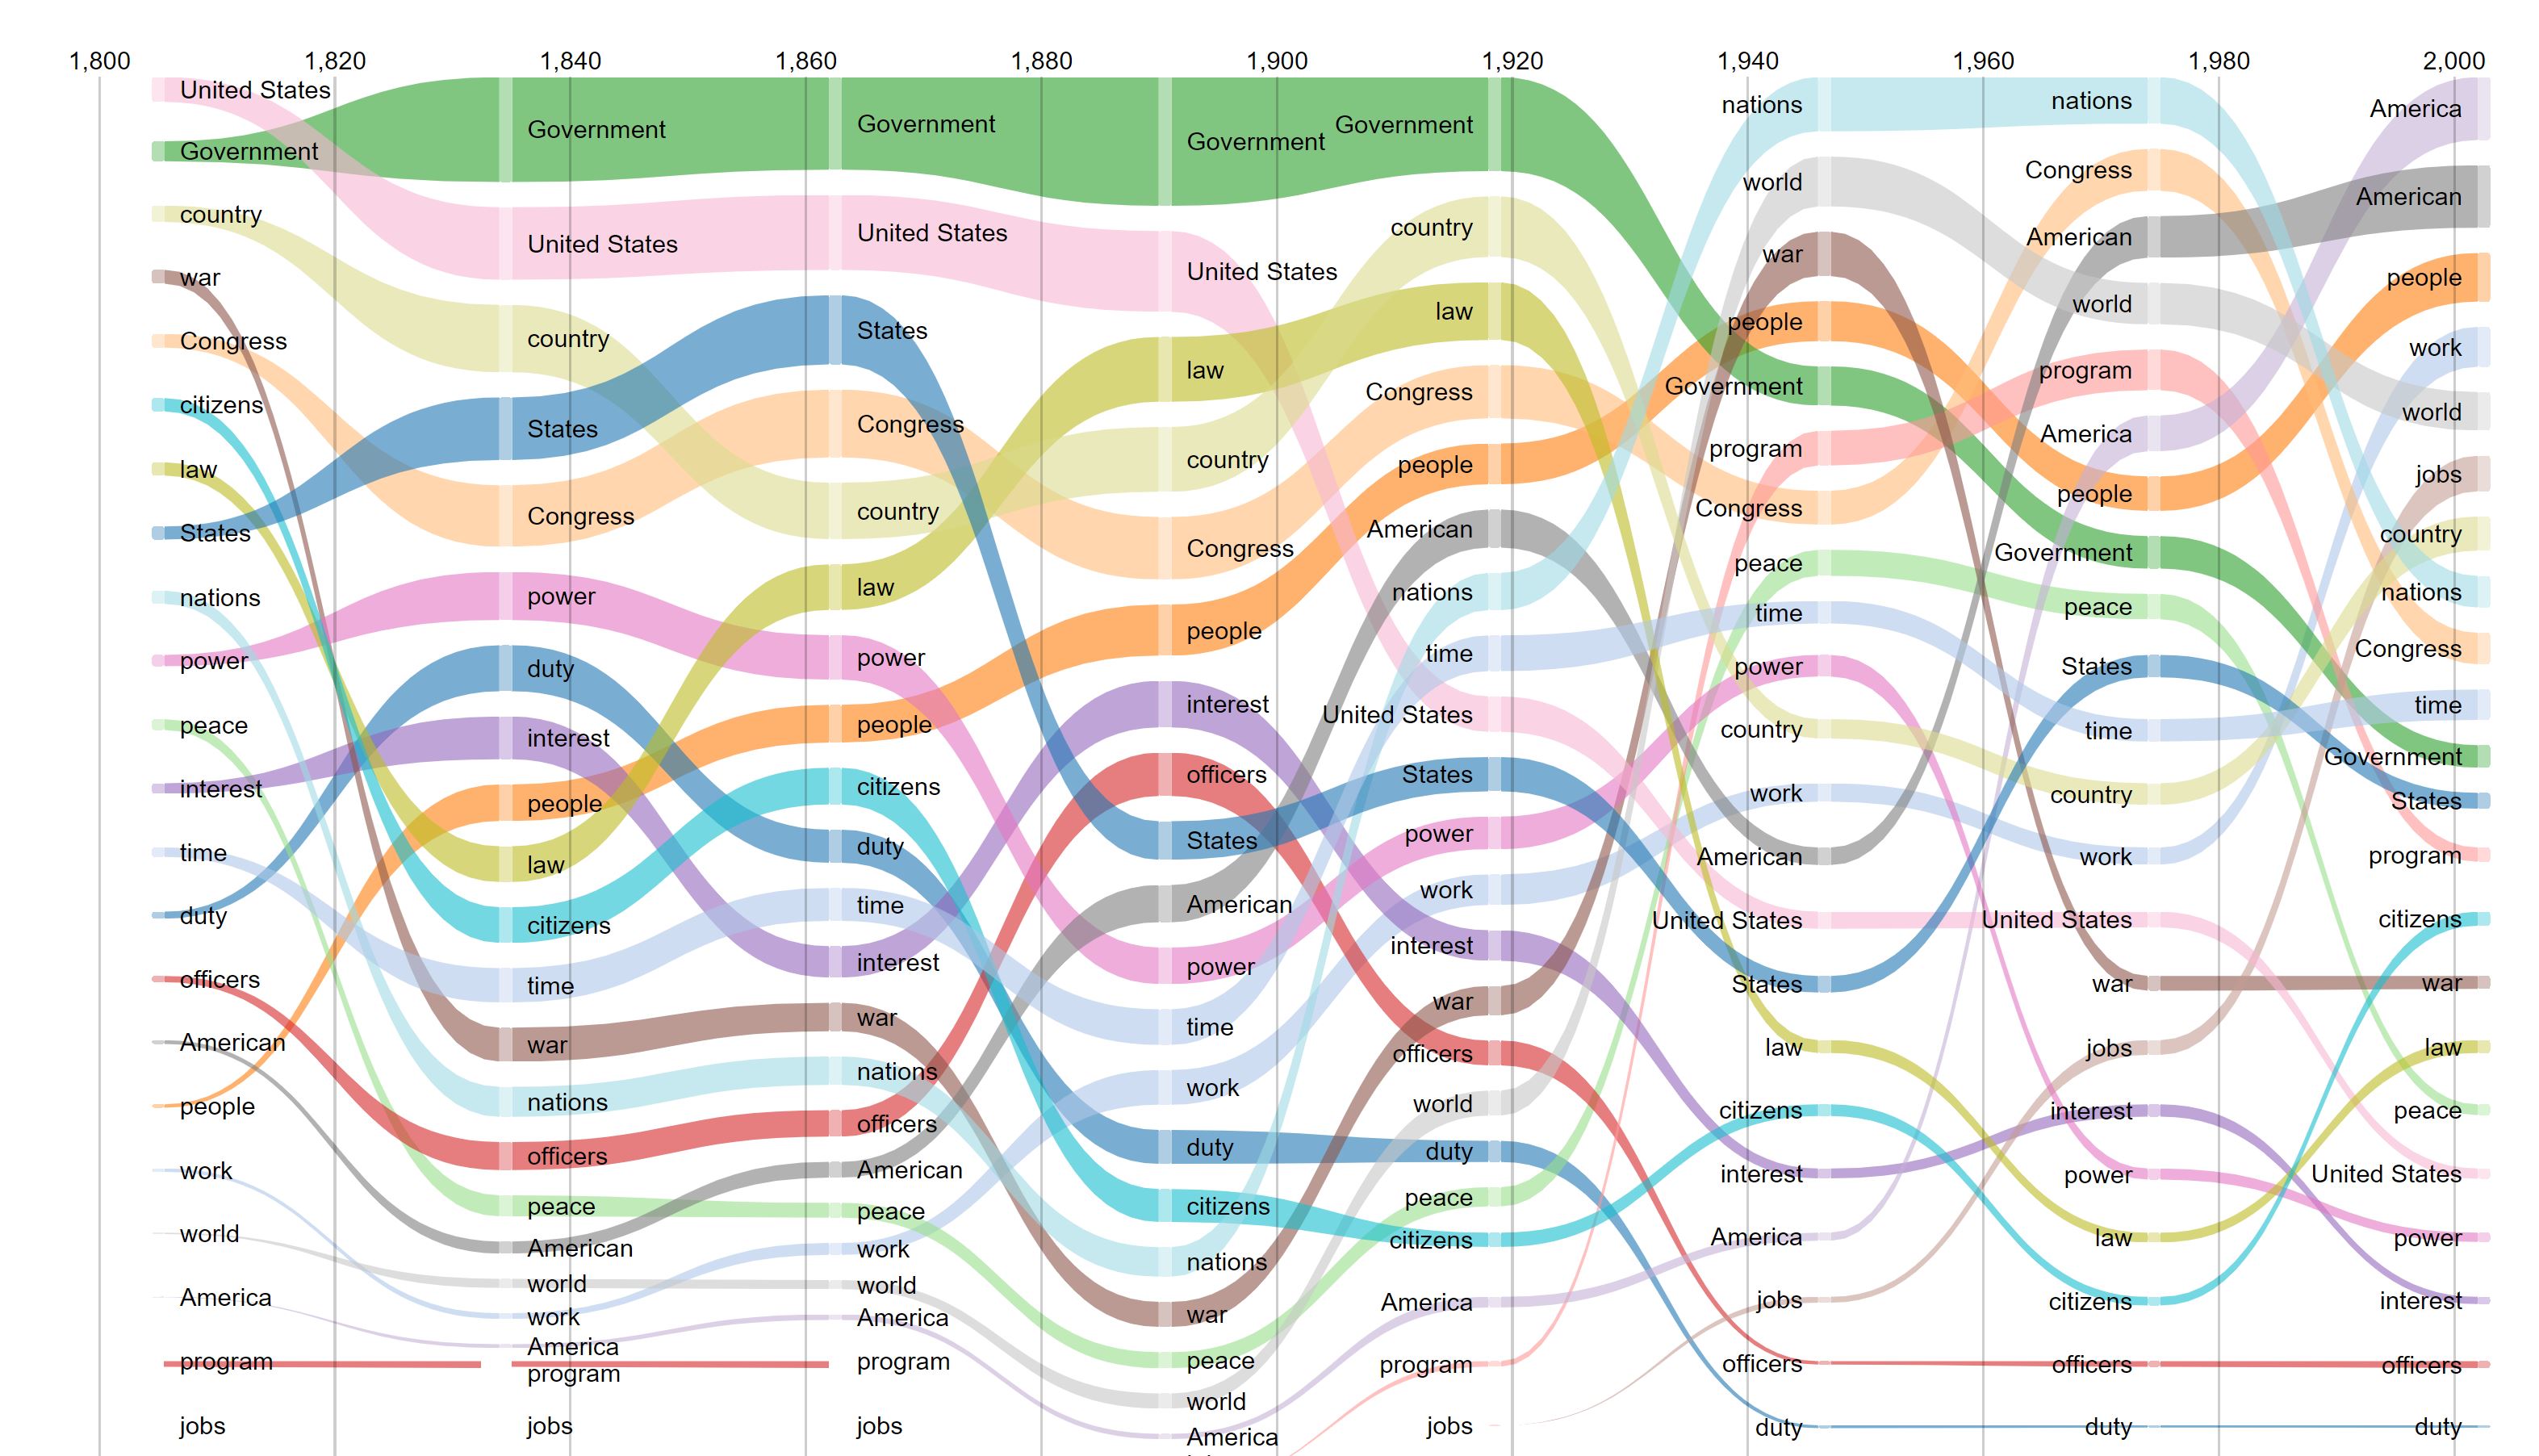
- A bump graph shows the evolution of frequency and ranking through time
Epic Epoch: data description parameters

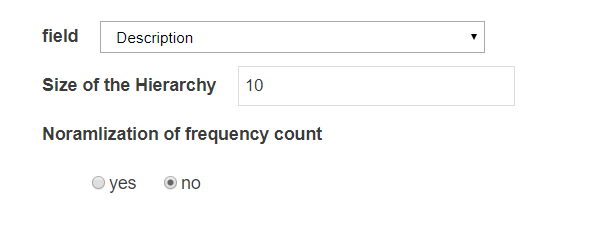
Field
The variable you are interested in tracking in your database.
Size of the Hierarchy
The number of top entities to consider at each time period and to track over all periods.
Normalization of frequency count
Activating this feature will forgo raw frequency count and count in percentages
Epic Epoch: dynamics parameters

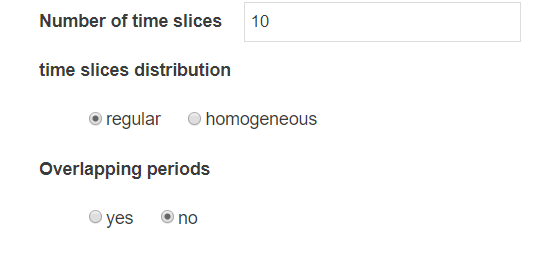
Number of time slices
Number of time periods in which you want to divide the visualization.
time slices distribution
Regular will cut into uniform periods of time. On the other hand, homogeneous will divide time frames so they contain the same number of documents (same parameter than: time slices distribution).
Overlapping periods
This will allow the time slice distribution to overlap different time periods, particularly useful if you are using homogeneous distribution (same parameter than: Overlapping periods).
Bump Graph Analysis
Note: Clicking on any of the white rectangle dividers within a word’s journey will highlight it’s entire dynamics.
Improvements and known issues
Solved issues
- Not yet, but it will come soon!
Known issues
- Due to the SQLite database engine used to store corpora, if a value – or some values – of the selected field is “data“, Epic Epoch will fail. See here to know more on how to deal with that issue in your project.
Section to expand with your feedbacks.


