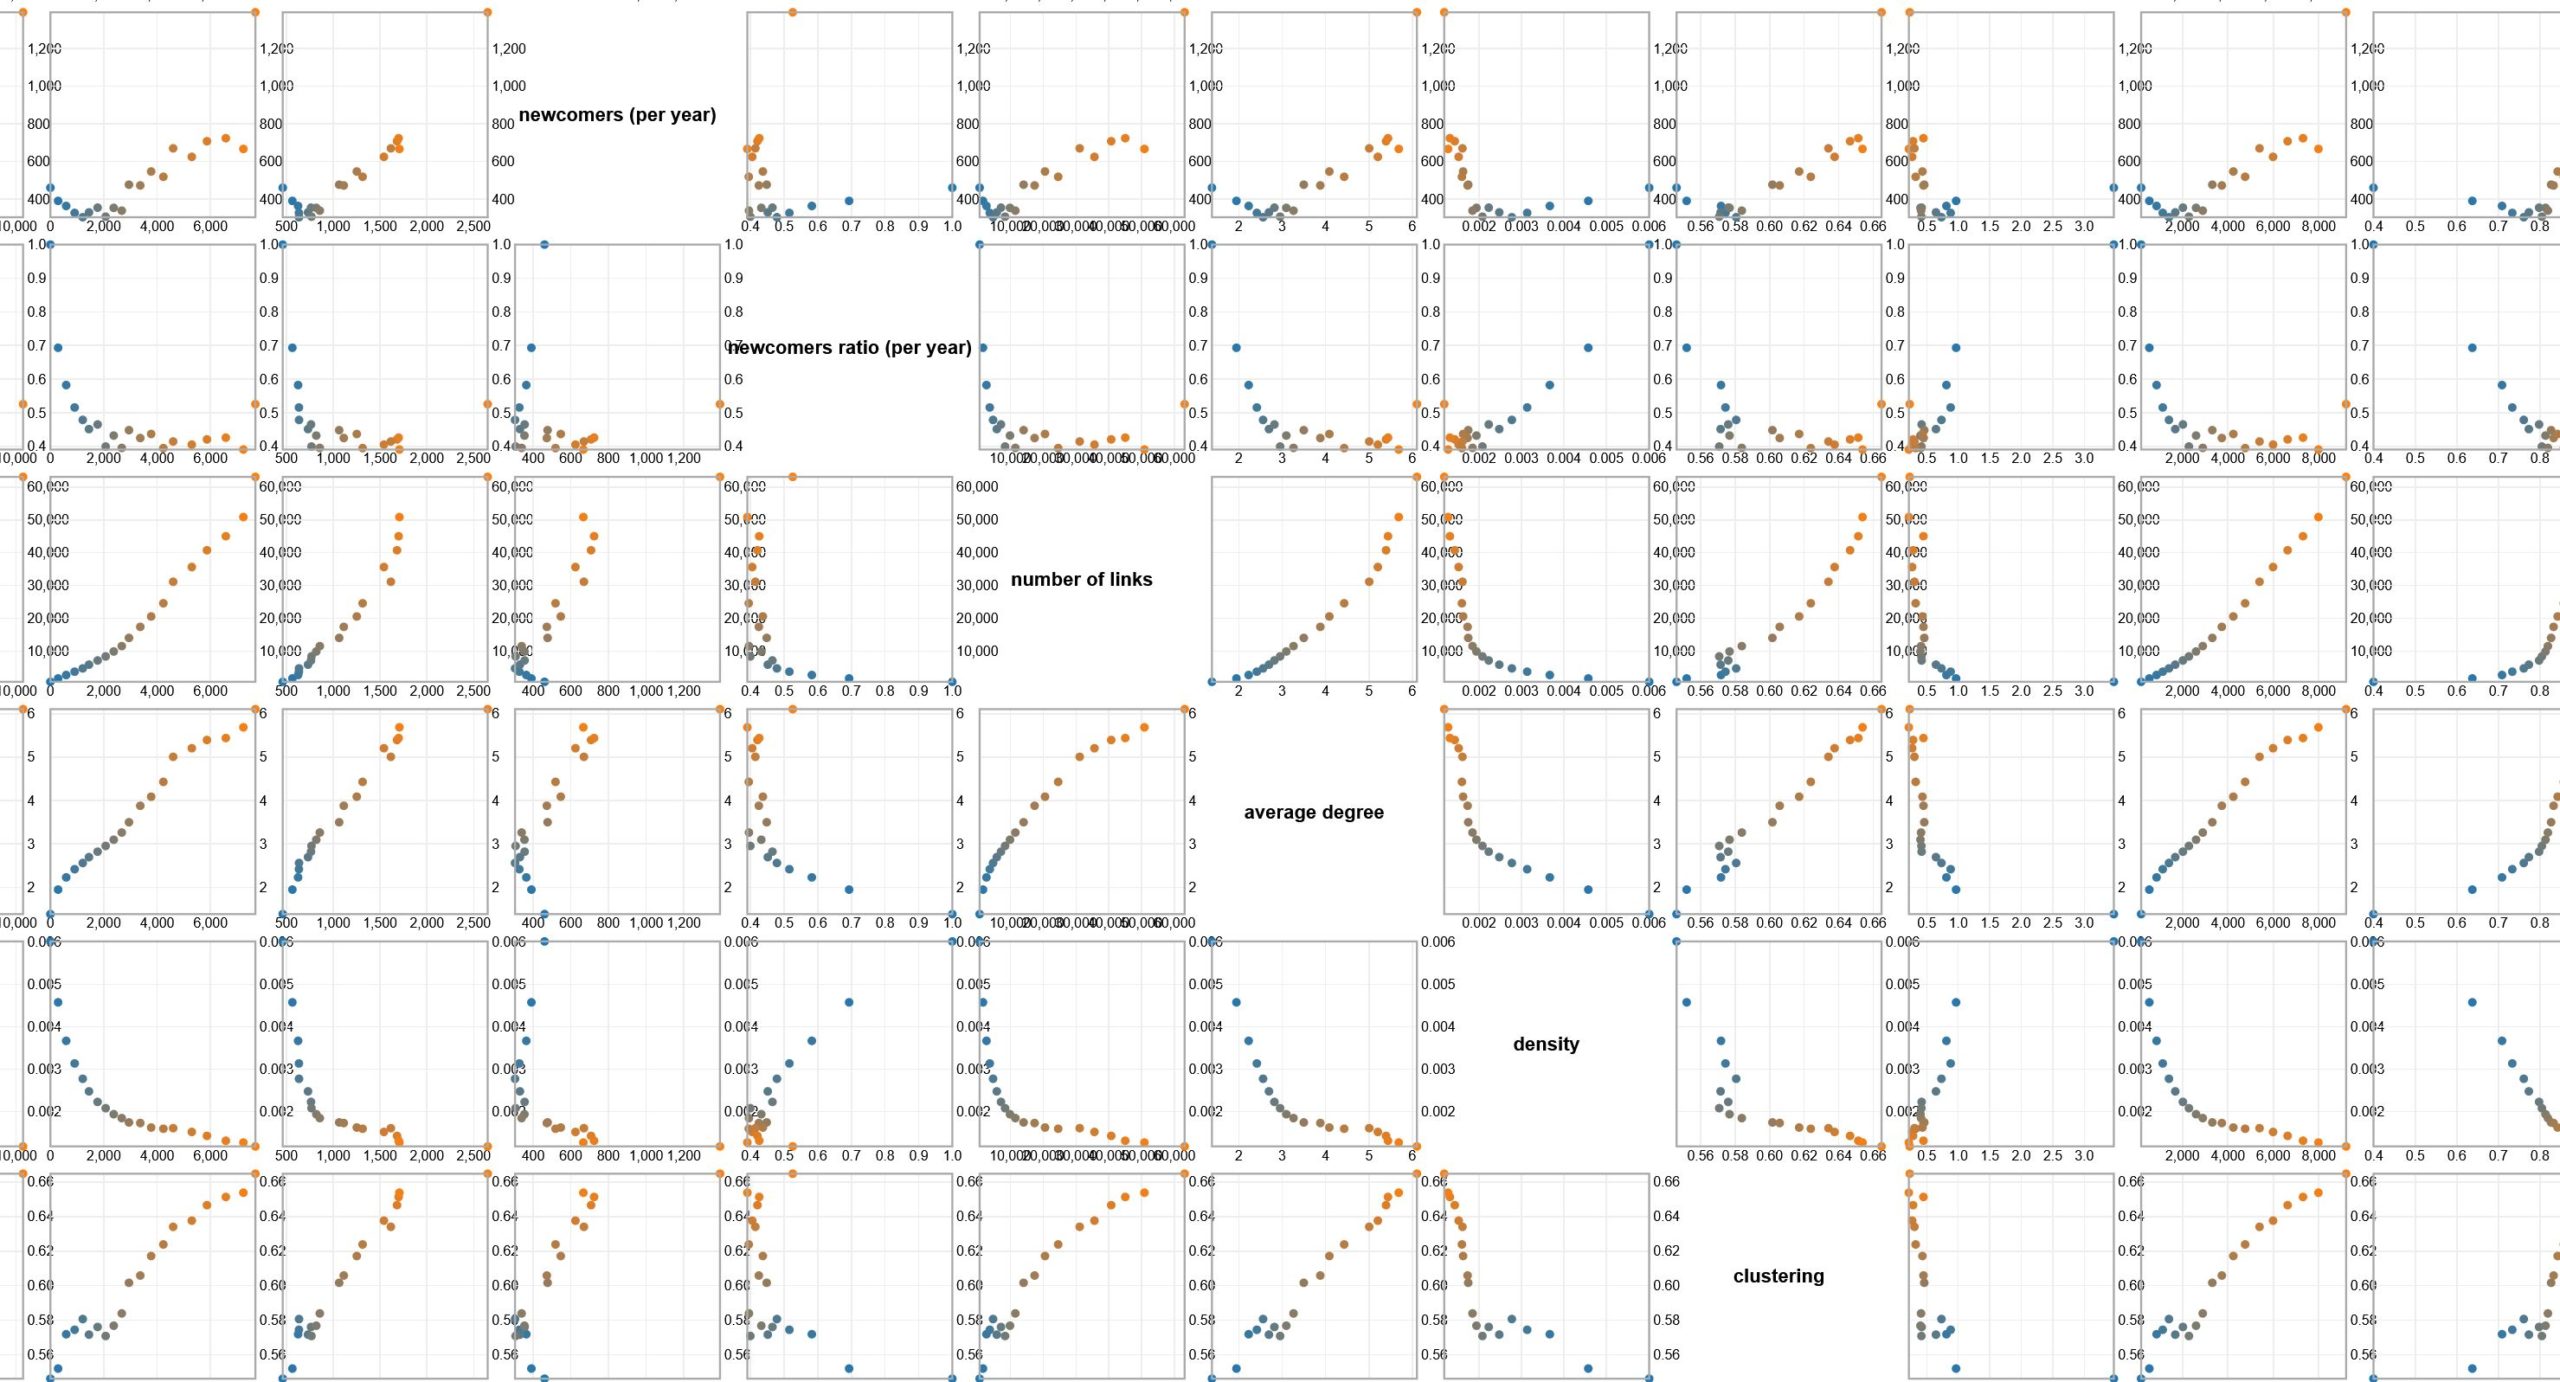
Structural analysis is particularly useful to get an overview of the evolution of a given field, topic. It provides statistics about macro-level measures of the resulting dynamics network. Size, nodes turnover, critical transition can be visualized in a unique representation.
The analysis differs from those conduced with a network mapping script (using the tubes) as it is at the nodes scale (and not at the clusters scale).
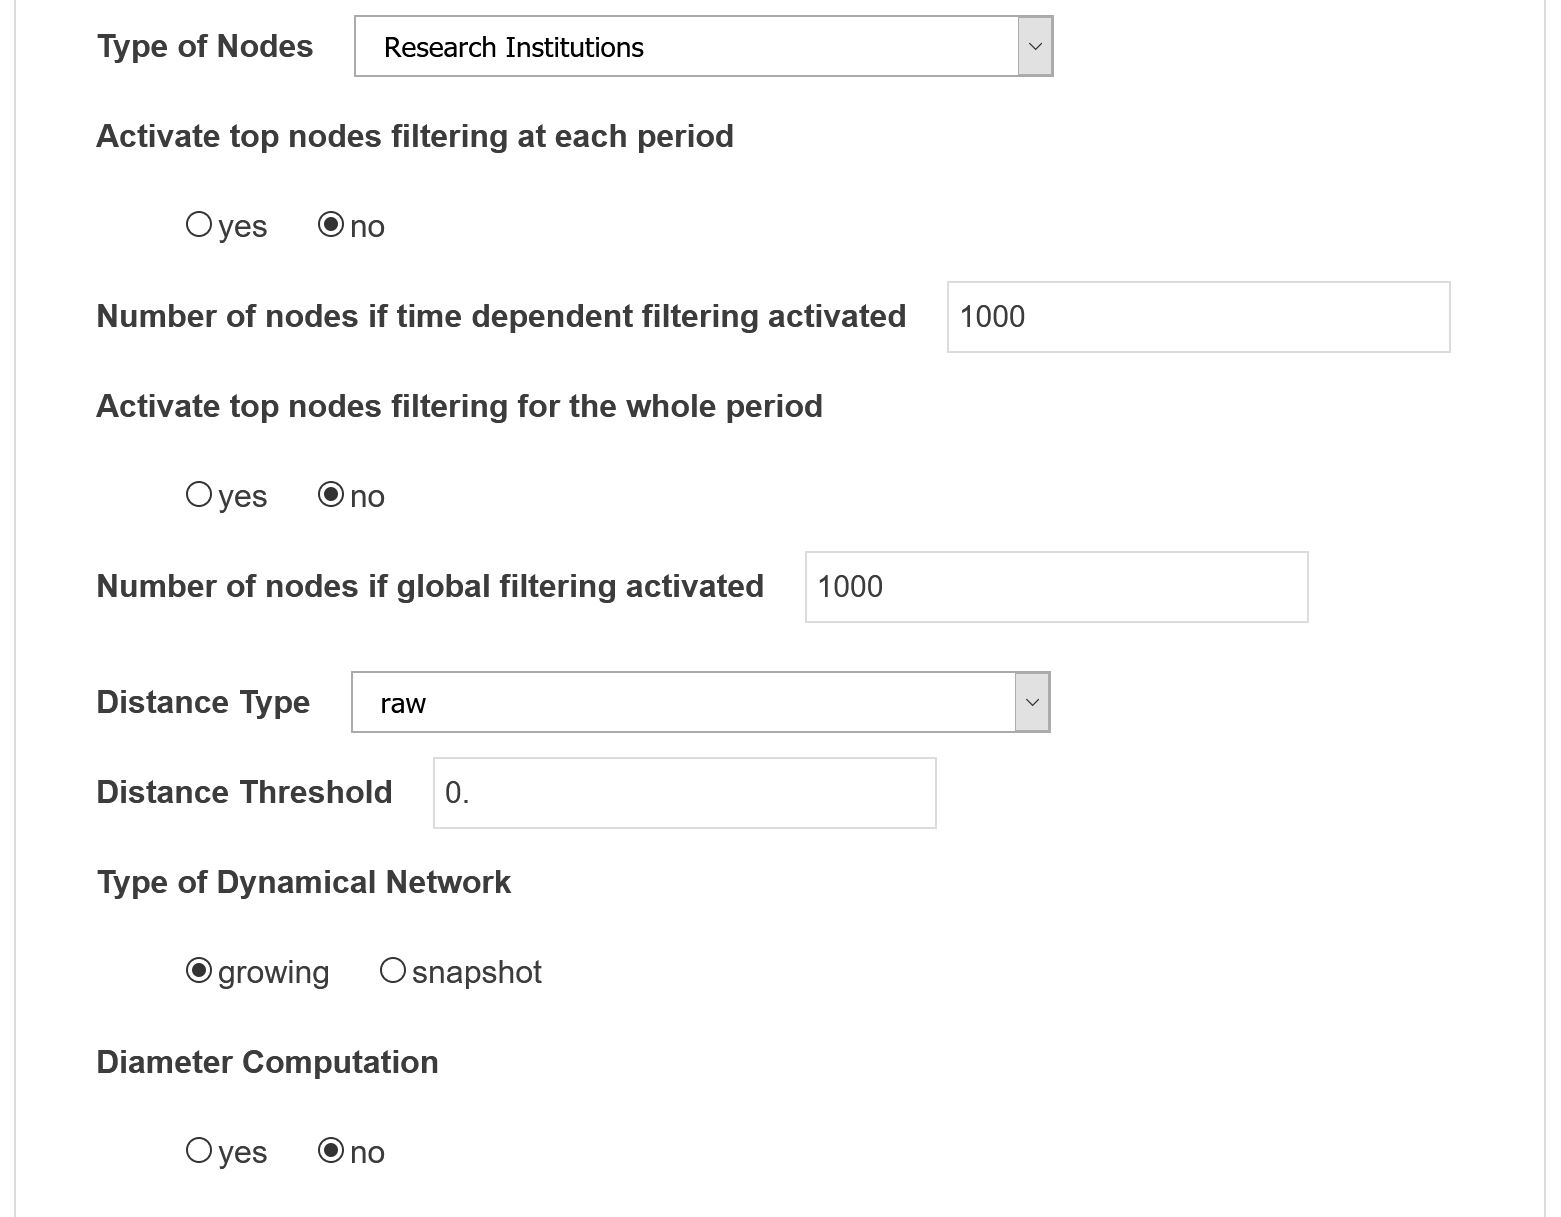
Structural Analysis parameters
First, choose the variable you want to study and, as a first try, keep the default parameters which fit for most of the needs. You may want to refine your analysis later on.

Example of statistics
active nodes (per year)
Actives entities from the variable in the corpus for the given year.
newcomers (per year)
New entities from the variable in the corpus for the given year, which were not present for the previous year.
newcomers ratio (per year)
Ratio between the newcomers and the total active entities for a given year.


